Tiedosto:Butterworth response.svg

Alkuperäinen tiedosto (SVG-tiedosto; oletustarkkuus 512 × 384 kuvapistettä; tiedostokoko 41 KiB)
| Tämä tiedosto on tiedostotietokanta Wikimedia Commonsista. Tiedot kuvaussivulta näkyvät alla. |  |
Tiedoston kuvaussivu Commonsissa |
Yhteenveto
| Kuvaus |
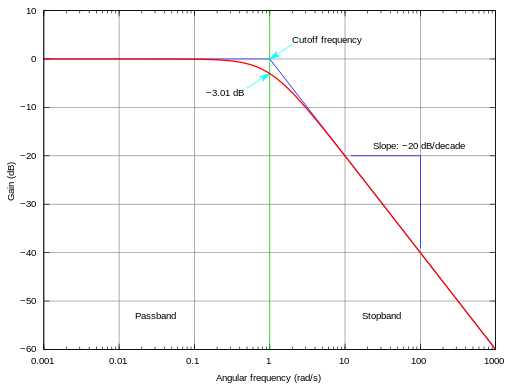
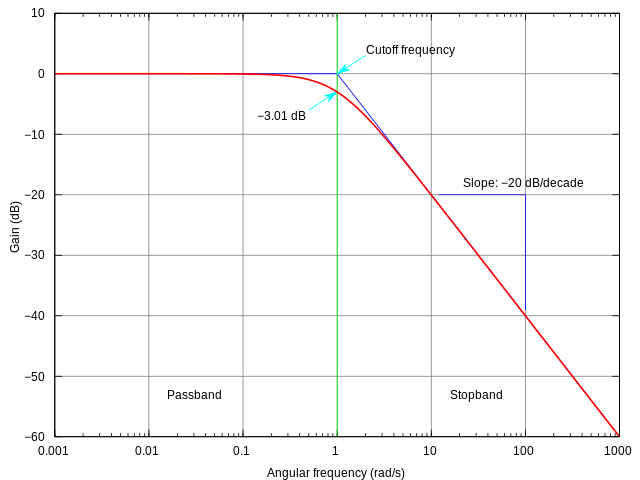
English: This is the SVG version of the PNG image created by Omegatron.
I simply changed the terminal type from PostScript to SVG in the gnuplot script file. The frequency response of a Butterworth filter with logarithmic axes (Bode plot) and various labels. Cutoff frequency is normalized to 1 rad/s. Gain is normalized to 0 dB in the passband.
|
||||
| Päiväys | (UTC) | ||||
| Lähde | |||||
| Tekijä |
|
||||
| Muut versiot |
|
||||
| gnuplot source | click to expand
set samples 2001
# set terminal postscript enhanced landscape color lw 2 "Times-Roman" 20
set terminal svg size 800 600 dynamic enhanced
set output "butterworth.svg"

# Butterworth amplitude response and decibel calculation.  n is the order, which is just 1 in this image.
G(w,n) = 1 / (sqrt(1 + w**(2*n)))
dB(x) = 20 * log10(abs(x))

# Gridlines
set grid

# Set x axis to logarithmic scale
set logscale x 10

# Set range of x and y axes
set xrange [0.001:1000]
set yrange [-60:10]

# Create x-axis tic marks once per decade (every multiple of 10)
set xtics 10

# Use 10 x-axis minor divisions per major division
set mxtics 10

# Axis labels
set xlabel "Angular frequency (rad/s)"
set ylabel "Gain (dB)"

# No need for a key
set nokey #0.1,-25

# Frequency response's line plotting style
set style line 1 lt 1 lw 2

# Draw a separator between passband and stopband and label them
set style line 2 lt 2 lw 1
set style arrow 2 nohead ls 2
set arrow 3 from 1,-60 to 1,10 as 2

# Label coordinates are relative to the graph window, not to the function, centered at the 1/4 and 3/4 width points
set label 1 "Passband" at graph 0.25, graph 0.1 c
set label 2 "Stopband" at graph 0.75, graph 0.1 c

# Asymptote lines and slope lines are the same "arrow" style
set style line 3 lt 3 lw 1
set style arrow 3 nohead ls 3

# Draw asymptote lines
set arrow 1 from 1,0 to 1000,-60 as 3
set arrow 2 from .001,0 to 1,0 as 3

# -3 dB arrow style and arrow
set style line 4 lt 4 lw 1
set style arrow 4 head filled size screen 0.02,15,45 ls 4
set arrow 4 from 2,3 to 1,0 as 4

# "Cutoff frequency" label uses same coordinates as the function
set label 3 "Cutoff frequency" at 2,4 l

# "-3 dB" label
set arrow 5 from 0.5,-6 to 1,-3 as 4
set label 4 "-3.01 dB" at 0.5,-7 r

# Draw slope lines and label
set arrow 6 from 100,-20 to 12,-20 as 3
set arrow 7 from 100,-20 to 100,-39 as 3
set label 5 "Slope: -20 dB/decade" at 100,-18 c

# Plot the filter response
plot
     dB(G(x,1)) ls 1  title "1st-order response"

unset output      # cleanup the handle
|


Lisenssi
- Voit:
- jakaa – kopioida, levittää ja esittää teosta
- remiksata – valmistaa muutettuja teoksia
- Seuraavilla ehdoilla:
- nimeäminen – Sinun on mainittava lähde asianmukaisesti, tarjottava linkki lisenssiin sekä merkittävä, mikäli olet tehnyt muutoksia. Voit tehdä yllä olevan millä tahansa kohtuullisella tavalla, mutta et siten, että annat ymmärtää lisenssinantajan suosittelevan sinua tai teoksen käyttöäsi.
- jaa samoin – Jos muutat tai perustat tähän työhön, voit jakaa tuloksena syntyvää työtä vain tällä tai tämän kaltaisella lisenssillä.

|
Voit kopioida, levittää ja/tai muuttaa tätä asiakirjaa GNU Free Documentation License -lisenssin version 1.2 tai minkä tahansa Free Software Foundationin julkaiseman myöhemmän version ehtojen alaisena; ei koske muuttumattomia kohtia, etukannen tekstejä eikä takakannen tekstejä. Kopio tästä lisenssistä on saatavilla osiossa GNU Free Documentation License. |
Alkuperäinen tallennusloki
This image is a derivative work of the following images:
- Image:Butterworth_response.png licensed with Cc-by-sa-3.0,2.5,2.0,1.0, GFDL
- 2005-07-23T17:45:55Z Omegatron 1240x880 (87607 Bytes) split the cutoff frequency markers
- 2005-07-23T16:31:54Z Omegatron 1250x880 (94570 Bytes) Better butterworth filter response curve
- 2005-06-26T19:54:33Z Omegatron 250x220 (2251 Bytes) A graph or diagram made by [[User:Omegatron]]. (Uploaded with Wikimedia Commons.) Source: Created by [[User:Omegatron]] {{GFDL}}{{cc-by-sa-2.0}} [[Category:Diagrams]]\
Uploaded with derivativeFX
Tiedoston historia
Päiväystä napsauttamalla näet, millainen tiedosto oli kyseisellä hetkellä.
| Päiväys | Pienoiskuva | Koko | Käyttäjä | Kommentti | |
|---|---|---|---|---|---|
| nykyinen | 25. huhtikuuta 2013 kello 12.50 | | 512 × 384 (41 KiB) | Incnis Mrsi | dehyphenation |
| 5. heinäkuuta 2008 kello 02.17 |  | 512 × 384 (41 KiB) | Krishnavedala | {{Information |Description=This is the en:SVG version of the en:PNG image created by en:User:Omegatron. I simply changed the terminal type from en:postscript to SVG in the en:GNUplot script file. The [[w:frequency response|frequency |
Tiedoston käyttö
Seuraava sivu käyttää tätä tiedostoa:
Tiedoston järjestelmänlaajuinen käyttö
Seuraavat muut wikit käyttävät tätä tiedostoa:
- Käyttö kohteessa ca.wikipedia.org
- Käyttö kohteessa cv.wikipedia.org
- Käyttö kohteessa de.wikipedia.org
- Käyttö kohteessa en.wikipedia.org
- Käyttö kohteessa en.wikibooks.org
- Käyttö kohteessa eo.wikipedia.org
- Käyttö kohteessa es.wikipedia.org
- Käyttö kohteessa et.wikipedia.org
- Käyttö kohteessa fa.wikipedia.org
- Käyttö kohteessa ko.wikipedia.org
- Käyttö kohteessa pt.wikipedia.org
- Käyttö kohteessa simple.wikipedia.org
- Käyttö kohteessa su.wikipedia.org
- Käyttö kohteessa uk.wikipedia.org
- Käyttö kohteessa vi.wikipedia.org
- Käyttö kohteessa zh.wikipedia.org