Tiedosto:20211109 Frequency of extreme weather for different degrees of global warming - bar chart IPCC AR6 WG1 SPM.svg

Alkuperäinen tiedosto (SVG-tiedosto; oletustarkkuus 1 200 × 675 kuvapistettä; tiedostokoko 5 KiB)
| Tämä tiedosto on tiedostotietokanta Wikimedia Commonsista. Tiedot kuvaussivulta näkyvät alla. |  |
Tiedoston kuvaussivu Commonsissa |
Yhteenveto
| Kuvaus |
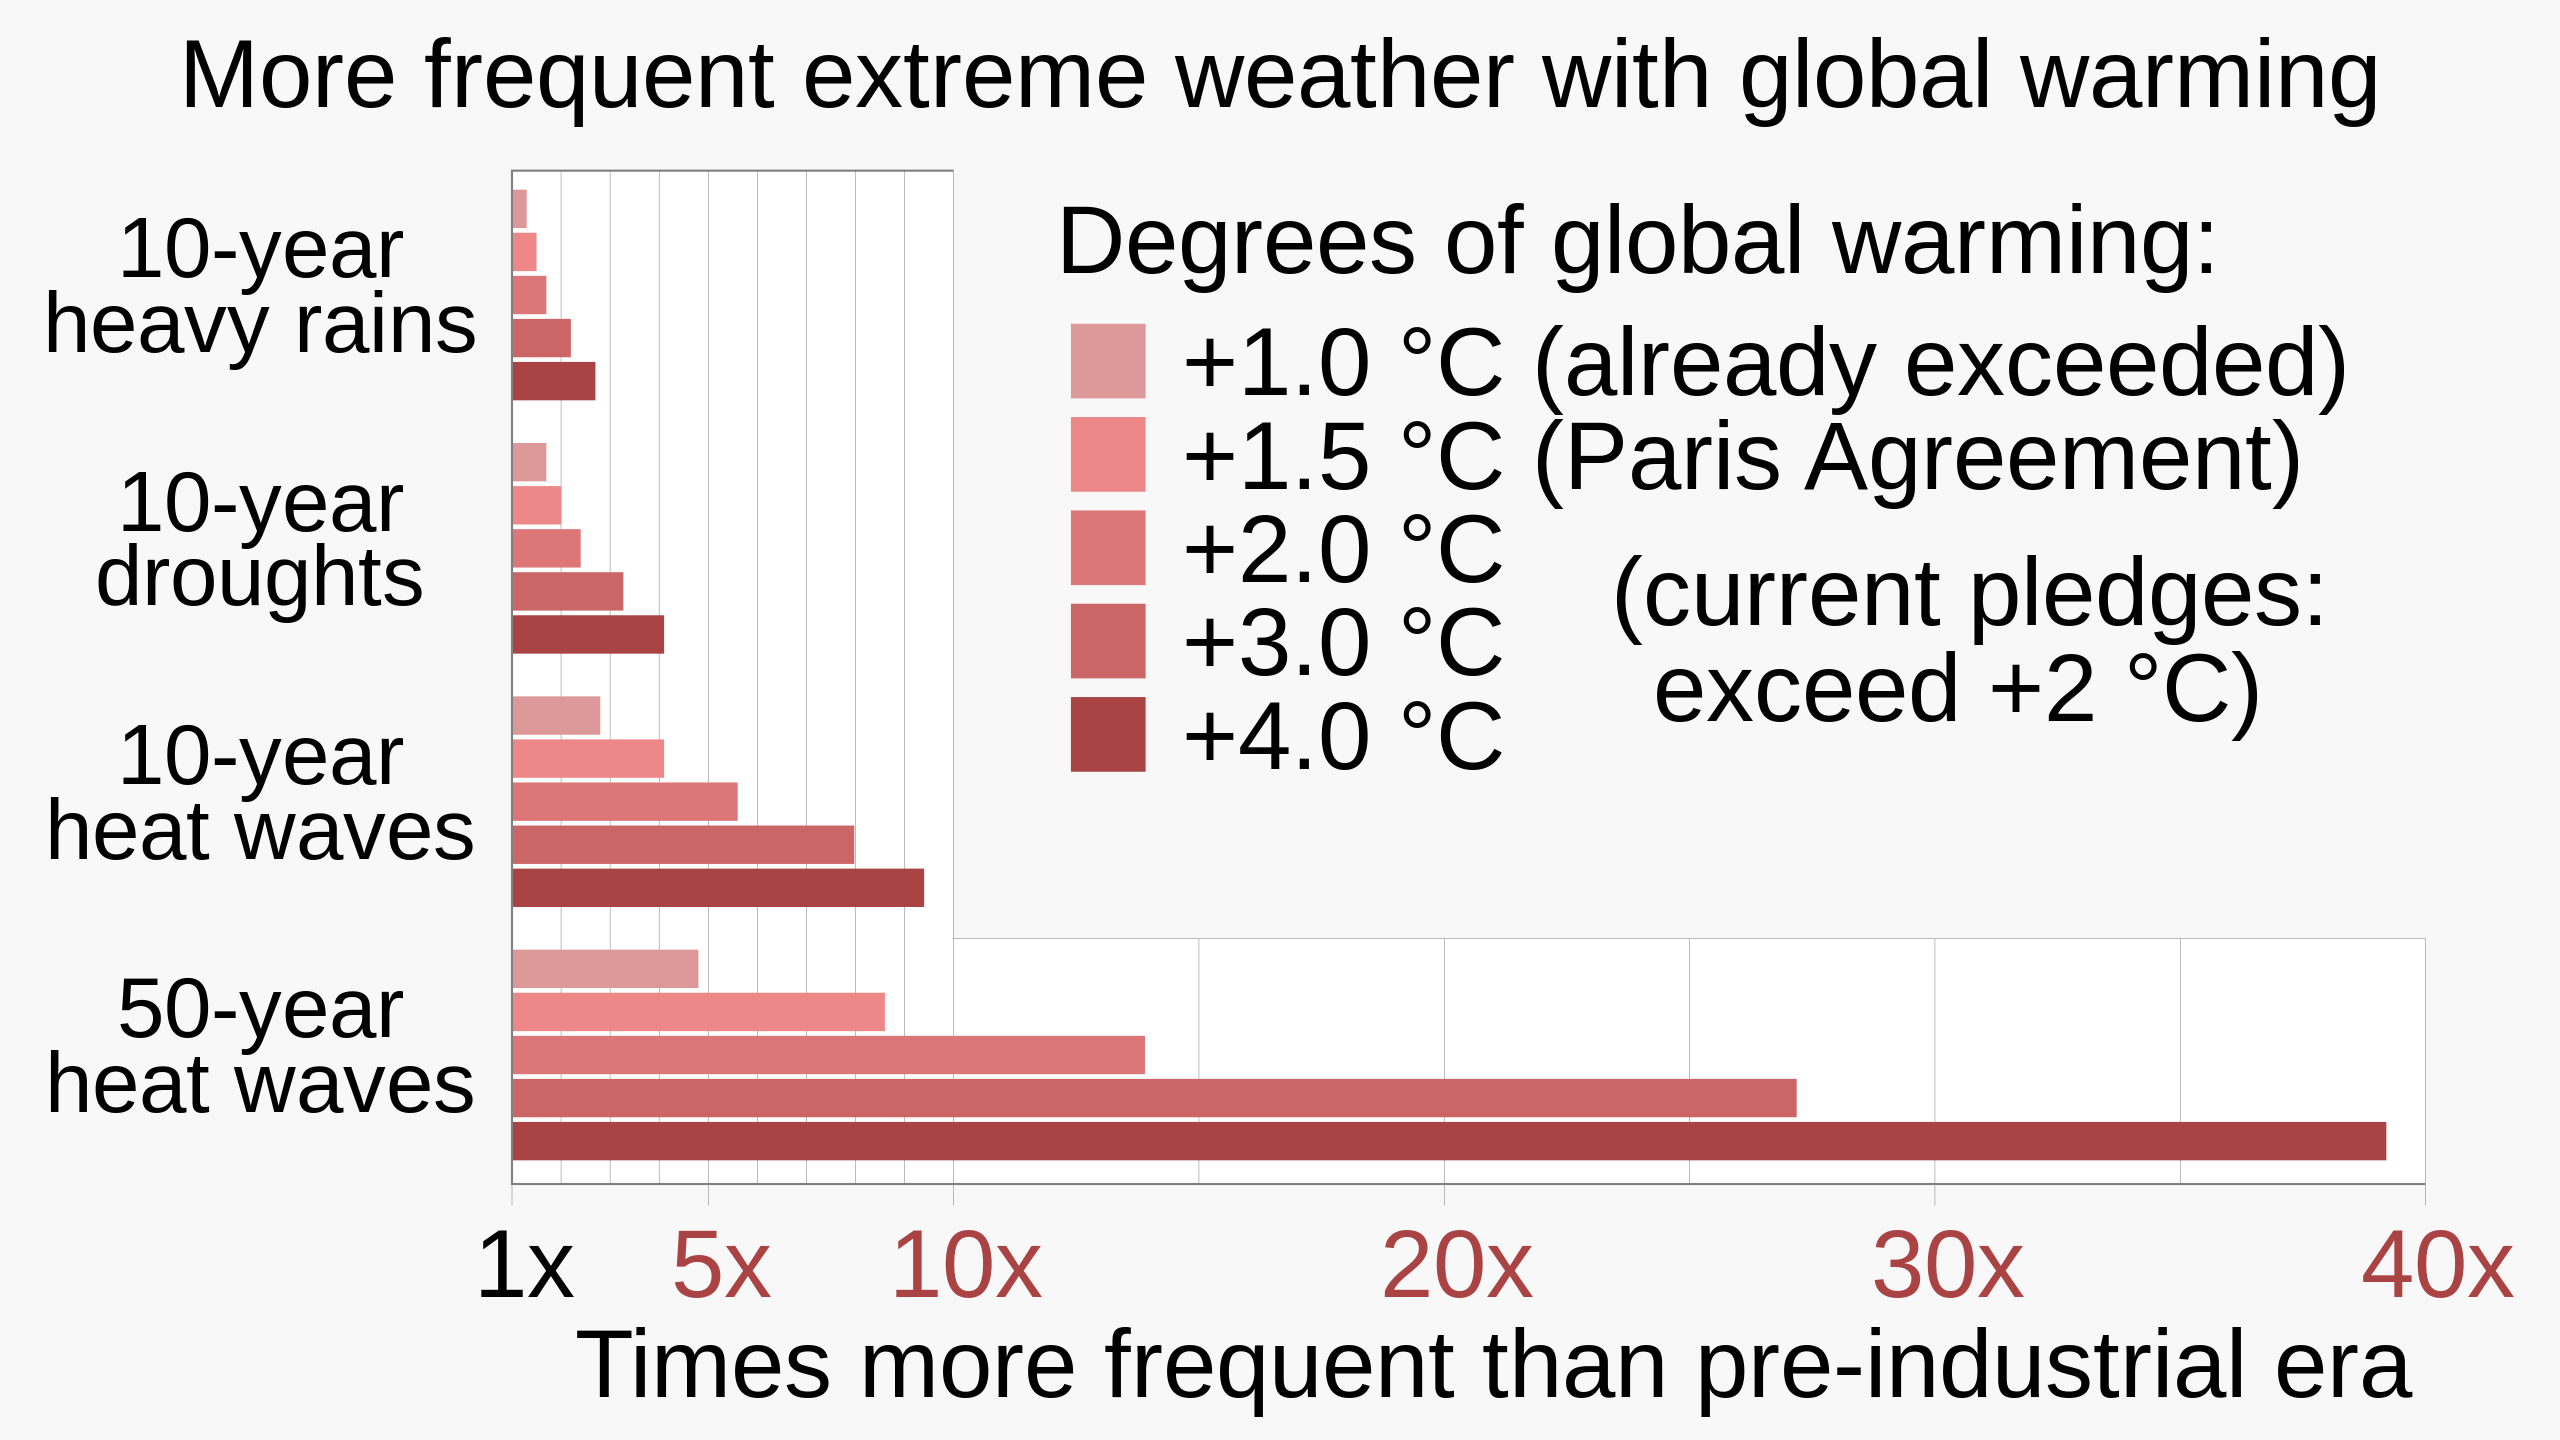
English: Bar chart showing frequency of extreme weather for different degrees of global warming, based on data from IPCC AR6 WG1 SPM (Summary for Policy Makers).
|
||||
| Päiväys | |||||
| Lähde | Oma teos | ||||
| Tekijä | RCraig09 | ||||
| Muut versiot |
|


Related files
The following files are based on Fig. SPM.6 of the Sixth Assessment Report of the Intergovernmental Panel on Climate Change / Summary for Policymakers:
-
 20210809 Projected extremes for different degrees of global warming - IPCC AR6 WG1 SPM.svg
9 August 2021: Line chart of 10- and 50-year datasets (includes frequency, omits intensity) -
 20211107 Projected extremes for different degrees of global warming - 3x10yr area chart - IPCC AR6 WG1 SPM.svg
7 Nov 2021: "L" charts includes both frequency and intensity of the 10-year datasets (omits 50-year dataset) -
 20211109 Frequency of extreme weather for different degrees of global warming - bar chart IPCC AR6 WG1 SPM.svg
9 Nov 2021: Bar chart of 10- and 50-year datasets (includes frequency, omits intensity) -
 20220208 Projected temperature extremes for different degrees of global warming - orthogonal bar chart - IPCC AR6 WG1 SPM.svg
Orthogonal bar chart of 10-year heat waves (only)


Lisenssi
- Voit:
- jakaa – kopioida, levittää ja esittää teosta
- remiksata – valmistaa muutettuja teoksia
- Seuraavilla ehdoilla:
- nimeäminen – Sinun on mainittava lähde asianmukaisesti, tarjottava linkki lisenssiin sekä merkittävä, mikäli olet tehnyt muutoksia. Voit tehdä yllä olevan millä tahansa kohtuullisella tavalla, mutta et siten, että annat ymmärtää lisenssinantajan suosittelevan sinua tai teoksen käyttöäsi.
- jaa samoin – Jos muutat tai perustat tähän työhön, voit jakaa tuloksena syntyvää työtä vain tällä tai tämän kaltaisella lisenssillä.
Tiedoston historia
Päiväystä napsauttamalla näet, millainen tiedosto oli kyseisellä hetkellä.
| Päiväys | Pienoiskuva | Koko | Käyttäjä | Kommentti | |
|---|---|---|---|---|---|
| nykyinen | 29. heinäkuuta 2023 kello 23.44 | | 1 200 × 675 (5 KiB) | RCraig09 | Version 12: remove <tspan> declarations embedded within <text> in the title "More frequent...", to work around ongoing text rendering problems on Wikimedia |
| 29. heinäkuuta 2023 kello 23.29 |  | 1 200 × 675 (5 KiB) | RCraig09 | Version 11: manually changing "+1.1 °C today" to "(already exceeded)" (in the English language portion) to future-proof this graphic . . . . retained JP translation <switch> elements without change | |
| 6. syyskuuta 2022 kello 07.57 |  | 1 200 × 675 (5 KiB) | Icosohedral | File uploaded using svgtranslate tool (https://svgtranslate.toolforge.org/). Added translation for zh. | |
| 21. joulukuuta 2021 kello 20.19 |  | 1 200 × 675 (3 KiB) | RCraig09 | Version 9: misc changes per suggestions on this file's Talk page. | |
| 22. marraskuuta 2021 kello 08.31 |  | 1 200 × 675 (3 KiB) | RCraig09 | Version 8: more exact 3.0 C values . . . colors of horizontal axis tick labels | |
| 18. marraskuuta 2021 kello 06.40 |  | 1 200 × 675 (3 KiB) | RCraig09 | Version 7: adding to legend, 2.7 C under current pledges, per discussions at en.wp's Talk:Climate change | |
| 17. marraskuuta 2021 kello 07.58 |  | 1 200 × 675 (4 KiB) | RCraig09 | Version 6: Enlarge some font sizes . . . . change some text | |
| 16. marraskuuta 2021 kello 09.07 |  | 1 200 × 675 (4 KiB) | RCraig09 | Version 5: Used Liberation Sans . . . changed legend to "Present-day =+1.1 C" | |
| 13. marraskuuta 2021 kello 21.25 |  | 1 200 × 675 (4 KiB) | RCraig09 | Version 4: includes thinner, white vertical gridlines that overlay the colored bars, to make it easier to determine extent of the bars. Darker, wider gridlines remain behind the gridlines so they're visible over the white background. | |
| 13. marraskuuta 2021 kello 07.21 |  | 1 200 × 675 (4 KiB) | RCraig09 | Version 3: reduced length of some vertical grid lines; removed most of the plot-area outline. |
Tiedoston käyttö
Tätä tiedostoa ei käytetä millään sivulla.
Tiedoston järjestelmänlaajuinen käyttö
Seuraavat muut wikit käyttävät tätä tiedostoa:
- Käyttö kohteessa bn.wikipedia.org
- Käyttö kohteessa de.wikipedia.org
- Käyttö kohteessa en.wikipedia.org
- Käyttö kohteessa eo.wikipedia.org
- Käyttö kohteessa ko.wikipedia.org
- Käyttö kohteessa ms.wikipedia.org
- Käyttö kohteessa pt.wikipedia.org
- Käyttö kohteessa ru.wikipedia.org
- Käyttö kohteessa rw.wikipedia.org
- Käyttö kohteessa tr.wikipedia.org
- Käyttö kohteessa zh.wikipedia.org