Tiedosto:1951- Percent of record temperatures that are cold or warm records.svg
Siirry navigaatioon
Siirry hakuun

Tämän PNG-esikatselun koko koskien SVG-tiedostoa: 800 × 560 kuvapistettä. Muut resoluutiot: 320 × 224 kuvapistettä | 640 × 448 kuvapistettä | 1 024 × 717 kuvapistettä | 1 280 × 896 kuvapistettä | 2 560 × 1 792 kuvapistettä | 1 000 × 700 kuvapistettä.
Alkuperäinen tiedosto (SVG-tiedosto; oletustarkkuus 1 000 × 700 kuvapistettä; tiedostokoko 6 KiB)
| Tämä tiedosto on tiedostotietokanta Wikimedia Commonsista. Tiedot kuvaussivulta näkyvät alla. |  |
Tiedoston kuvaussivu Commonsissa |
Yhteenveto
| Kuvaus |
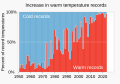
English: Chart showing percent of record temperatures that are cold records or warm records
|
||
| Päiväys | |||
| Lähde | Oma teos | ||
| Tekijä | RCraig09 |

Related files
-
 01 January - Percent of global area at temperature records - Global warming - NOAA.svg
(January data) -
 02 February - Percent of global area at temperature records - Global warming - NOAA.svg
(February data) -
 03 March - Percent of global area at temperature records - Global warming - NOAA.svg
(March data) -
 04 April - Percent of global area at temperature records - Global warming - NOAA.svg
(April data) -
 05 May - Percent of global area at temperature records - Global warming - NOAA.svg
(May data) -
 06 June - Percent of global area at temperature records - Global warming - NOAA.svg
(June data)


-
 07 July - Percent of global area at temperature records - Global warming - NOAA.svg
(July data) -
 08 August - Percent of global area at temperature records - Global warming - NOAA.svg
(August data) -
 09 September - Percent of global area at temperature records - Global warming - NOAA.svg
(September data) -
 10 October - Percent of global area at temperature records - Global warming - NOAA.svg
(October data) -
 11 November - Percent of global area at temperature records - Global warming - NOAA.svg
(November data) -
 12 December - Percent of global area at temperature records - Global warming - NOAA.svg
(December data)


-
 1951+ Percent of global area at temperature records - Seasonal comparison - NOAA.svg
Seasonal comparison -
 1951 - Percent of global area at temperature records (monthly) - Global warming - NOAA.svg
All months scatterplot/dot plot -
 1951- RATIO of new record warm temperatures to new record cold temperatures (monthly) - Global warming.svg
Ratios scatterplot/dot plot (monthly) -
 1951- Percent of record temperatures that are cold or warm records.svg
 -
 1951- Warm and cold record temperatures - bar chart.svg

_-_Global_warming_-_NOAA.svg)
_-_Global_warming.svg)


Lisenssi
Minä, tämän teoksen tekijänoikeuksien haltija, julkaisen täten tämän teoksen seuraavalla lisenssillä:
Tämä tiedosto on lisensoitu Creative Commons Nimeä-JaaSamoin 4.0 Kansainvälinen -lisenssillä.
- Voit:
- jakaa – kopioida, levittää ja esittää teosta
- remiksata – valmistaa muutettuja teoksia
- Seuraavilla ehdoilla:
- nimeäminen – Sinun on mainittava lähde asianmukaisesti, tarjottava linkki lisenssiin sekä merkittävä, mikäli olet tehnyt muutoksia. Voit tehdä yllä olevan millä tahansa kohtuullisella tavalla, mutta et siten, että annat ymmärtää lisenssinantajan suosittelevan sinua tai teoksen käyttöäsi.
- jaa samoin – Jos muutat tai perustat tähän työhön, voit jakaa tuloksena syntyvää työtä vain tällä tai tämän kaltaisella lisenssillä.
Tiedoston historia
Päiväystä napsauttamalla näet, millainen tiedosto oli kyseisellä hetkellä.
| Päiväys | Pienoiskuva | Koko | Käyttäjä | Kommentti | |
|---|---|---|---|---|---|
| nykyinen | 26. tammikuuta 2024 kello 00.41 | | 1 000 × 700 (6 KiB) | RCraig09 | Version 2: change shade of blue to correspond to change in related File:1951- Warm and cold record temperatures - bar chart.svg |
| 24. tammikuuta 2024 kello 23.24 |  | 1 000 × 700 (6 KiB) | RCraig09 | Uploaded own work with UploadWizard |
Tiedoston käyttö
Tätä tiedostoa ei käytetä millään sivulla.
Tiedoston järjestelmänlaajuinen käyttö
Seuraavat muut wikit käyttävät tätä tiedostoa:
- Käyttö kohteessa ar.wikipedia.org
- Käyttö kohteessa en.wikipedia.org