Tiedosto:Newton iteration.png
Siirry navigaatioon
Siirry hakuun
Tämän esikatselun koko: 729 × 599 kuvapistettä. Muut resoluutiot: 292 × 240 kuvapistettä | 584 × 480 kuvapistettä | 934 × 768 kuvapistettä | 1 246 × 1 024 kuvapistettä | 2 406 × 1 978 kuvapistettä.
Alkuperäinen tiedosto (2 406 × 1 978 kuvapistettä, 55 KiB, MIME-tyyppi: image/png)
| Tämä tiedosto on tiedostotietokanta Wikimedia Commonsista. Tiedot kuvaussivulta näkyvät alla. |  |
Tiedoston kuvaussivu Commonsissa |
Yhteenveto

|
Tästä tiedostosta on saatavilla myös SVG-versio eli vektorigrafiikkatiedosto. SVG-versiota tulisi suosia, mikäli se on laadultaan tätä rasterikuvaa parempi.
File:Newton iteration.png → File:Newton iteration.svg
|
 |
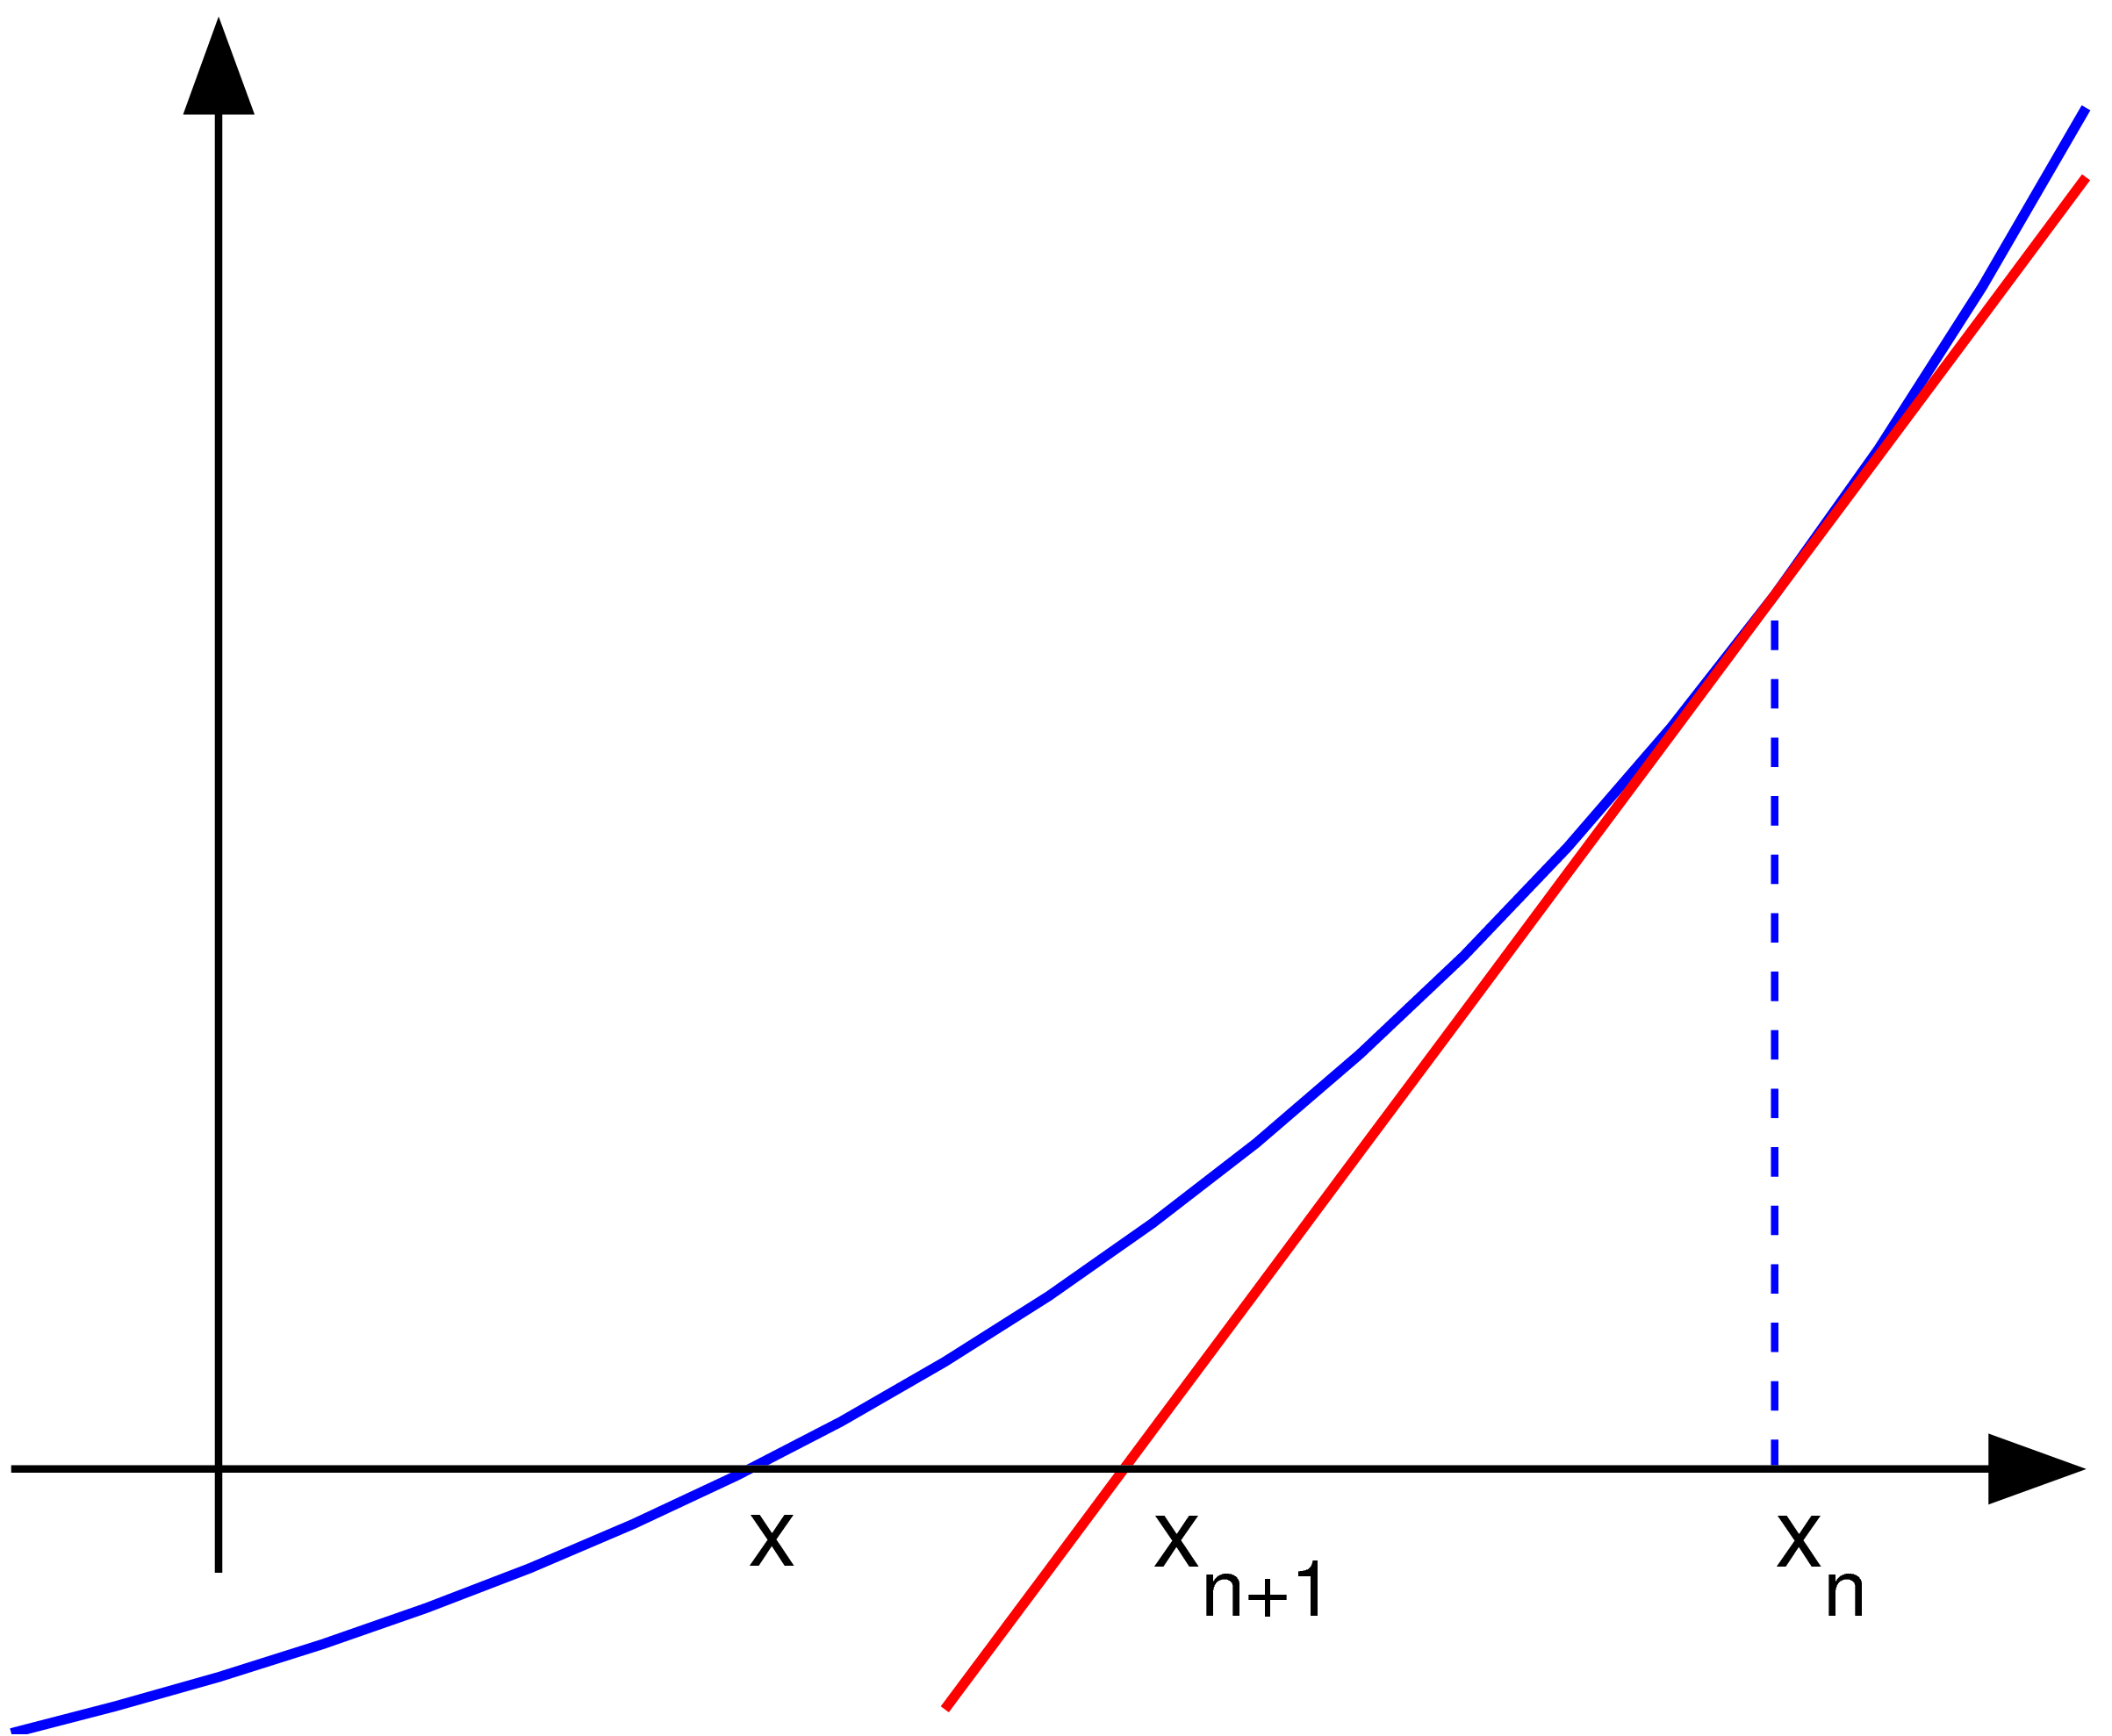
| Kuvaus | Uploader graphed this with en:MATLAB (Illustration of en:Newton's method) | ||
| Päiväys | 22. marraskuuta 2004 (first version); 2004-11-23 (last version) | ||
| Lähde | Siirretty projektista en.wikipedia Commonsiin. | ||
| Tekijä | Olegalexandrov projektissa Wikipedia kielellä englanti | ||
| PNG kehittely | Tämä PNG tietokonegrafiikka luotiin käyttäen apuna ohjelmaa MATLAB | ||
| Lähdekoodi | MATLAB code
|
Lisenssi
| Tämän teoksen tekijä, Olegalexandrov projektissa Wikipedia kielellä englanti, on julkaissut sen public domainiin. Tämä on voimassa maailmanlaajuisesti. Joissain maissa laki ei mahdollista tätä. Mikäli näin on: Olegalexandrov myöntää kaikille oikeuden käyttää tätä teosta mihin tahansa tarkoitukseen ilman minkäänlaisia ehtoja, ellei laki vaadi ehtojen asettamista. |
Alkuperäinen tallennusloki
Alkuperäinen kuvaussivu oli täällä. Käyttäjätunnukset alla viittaavat kohteeseen en.wikipedia.
- 2004-11-23 19:55 Olegalexandrov 405×340×8 (14290 bytes) Scaled down the picture of Newton's method
- 2004-11-22 21:34 Olegalexandrov 509×406×8 (16510 bytes) I graphed this with Matlab (Illustration of Newton's method) {{PD}}
Tiedoston historia
Päiväystä napsauttamalla näet, millainen tiedosto oli kyseisellä hetkellä.
| Päiväys | Pienoiskuva | Koko | Käyttäjä | Kommentti | |
|---|---|---|---|---|---|
| nykyinen | 25. toukokuuta 2007 kello 06.23 | | 2 406 × 1 978 (55 KiB) | Oleg Alexandrov | {{Information |Description=Uploader graphed this with en:MATLAB (Illustration of en:Newton's method) ==Source code== <pre> <nowiki> % illustration of Newton's method for finding a zero of a function function main () a=-1; b=1; % interva |
| 13. kesäkuuta 2005 kello 02.11 |  | 405 × 340 (6 KiB) | Everlong | optimized for smaller file size | |
| 18. tammikuuta 2005 kello 02.06 |  | 405 × 340 (14 KiB) | Andreas Ipp~commonswiki | {{PD}}: Original author graphed this with MATLAB (Illustration of Newton's method), from Wikipedia. |
Tiedoston käyttö
Tätä tiedostoa ei käytetä millään sivulla.
Tiedoston järjestelmänlaajuinen käyttö
Seuraavat muut wikit käyttävät tätä tiedostoa:
- Käyttö kohteessa en.wikipedia.org
- Käyttö kohteessa fr.wikipedia.org