Tiedosto:European-union-renewables-new.svg

Alkuperäinen tiedosto (SVG-tiedosto; oletustarkkuus 558 × 457 kuvapistettä; tiedostokoko 313 KiB)
| Tämä tiedosto on tiedostotietokanta Wikimedia Commonsista. Tiedot kuvaussivulta näkyvät alla. |  |
Tiedoston kuvaussivu Commonsissa |
Yhteenveto
| Kuvaus |
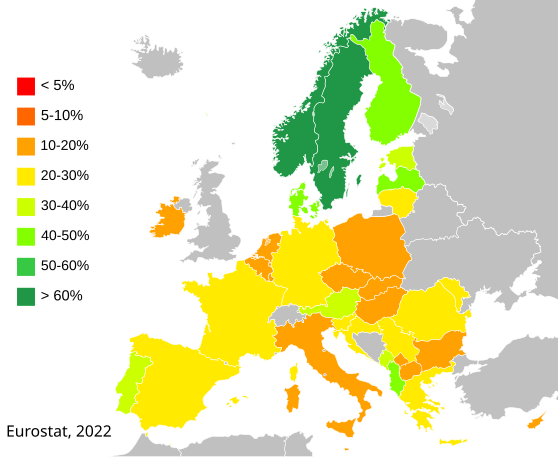
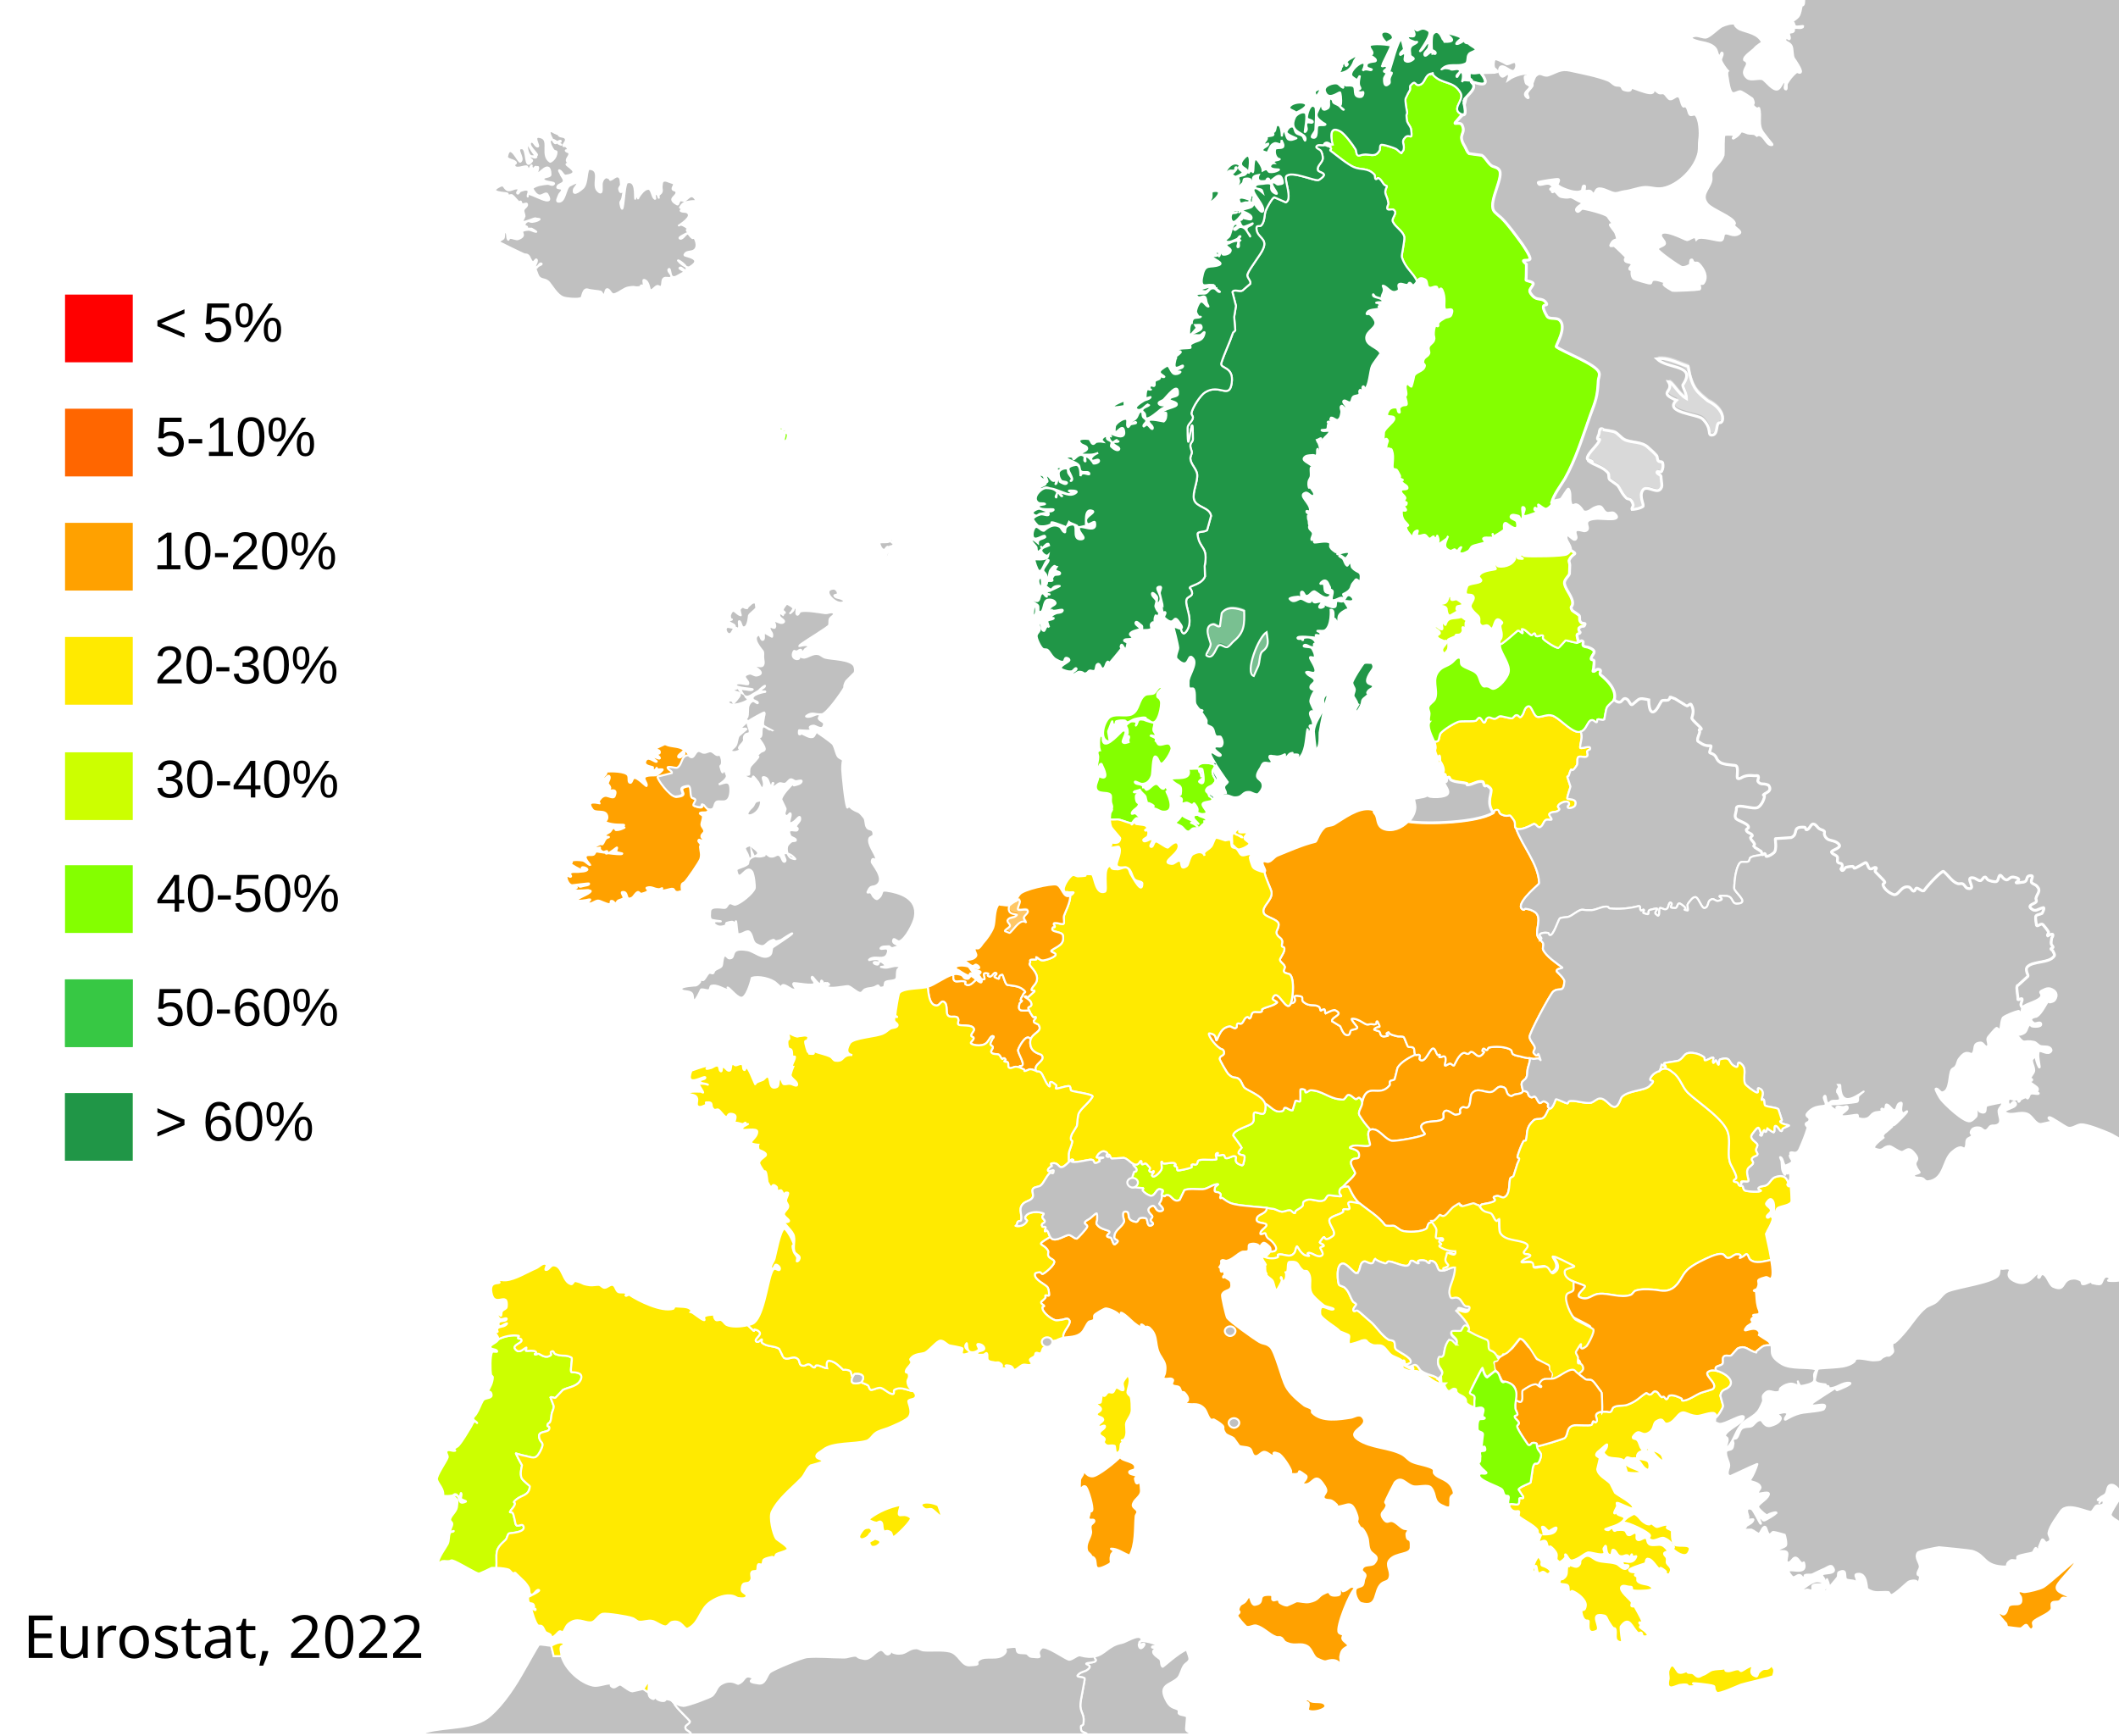
English: Share of renewable energy in gross final energy consumption in 2019. The average of renewable energy in the European Union (EU-28) increased in 2013 by 0.7% to 15.0% compared to 2012.
▇ n.a. Percentage of renewables on the overall energy consumption by country in descending percentage order for 2013: Norway (65.5%), Sweden (52.1%), Latvia (37.1%), Finland (36.8%), Austria (32.6%), Denmark (27.2%), Portugal (25.7%), Estonia (25.6%), Romania (23.9%), Switzerland (21.1%, source: SFOE), Lithuania (23.0%), Slovenia (21.5%), Bulgaria (19.0%), Croatia (18.0%), Italy (16.7%), Spain (15.4%), Greece (15.0%), Average in the European Union (15.0%, EU-28), France (14.2%), Czech Republic (12.4%), Germany (12.4%), Poland (11.3%), Hungary (9.8%), Slovakia (9.8%), Cyprus (8.1%), Belgium (7.9%), Ireland (7.8%), United Kingdom (5.1%), Netherlands (4.5%), Malta (3.8%), Luxembourg (3.6%, estimate). Explanation of the Share of renewable energy in gross final energy consumption. This indicator is calculated on the basis of data covered by Regulation (EC) No 1099/2008 on energy statistics. Reporting countries provide additional information on renewable source not covered by the Regulation. This indicator may be considered an estimate of the indicator described in Directive 2009/28/EC because statistical systems in some countries are not yet fully developed to meet all the requirements of this Directive. More information about the renewable energy shares calculation methodology can be found on the Eurostat websiteČeština: Podíl obnovitelná energie na hrubé konečné spotřebě energie za rok 2019 ve vybraných evropských zemích. Průměrný podíl energie z obnovitelných zdrojů v Evropské unii (EU-28) se v roce 2013 zvýšil o 0,7 % na 15,0 % oproti roku 2012. ▇ nejsou data Procentuální podíl obnovitelných zdrojů na celkové spotřebě energie podle zemí v sestupném procentuálním pořadí za rok 2013: Norsko (65,5 %), Švédsko (52,1 %), Lotyšsko (37,1 %), Finsko (36,8 %), Rakousko (32,6 %), Dánsko (27,2 %), Portugalsko (25,7 %), Estonsko (25,6 %), Rumunsko (23,9 %), Švýcarsko (21,1 %, zdroj: SFOE), Litva (23,0 %), Slovinsko (21,5 %), Bulharsko (19,0 %), Chorvatsko (18,0 %), Itálie (16,7 %), Španělsko (15,4 %), Řecko (15 %). 0%), průměr v Evropské unii" (15,0%, "EU-28"), Francie (14,2%), Česká republika (12,4%), Německo (12,4%), Polsko (11,3%), Maďarsko (9,8%), Slovensko (9,8%), Kypr (8,1%), Belgie (7,9%), Irsko (7,8%), Spojené království (5,1%), Nizozemsko (4,5%), Malta (3,8%), Lucembursko (3,6%, "odhad"). Vysvětlení údaje Podíl energie z obnovitelných zdrojů na hrubé konečné spotřebě energie. Tento ukazatel se vypočítává na základě údajů, na které se vztahuje nařízení (ES) č. 1099/2008 o energetické statistice. Vykazující země poskytují dodatečné informace o obnovitelných zdrojích, na které se nařízení nevztahuje. Tento ukazatel lze považovat za odhad ukazatele popsaného ve směrnici 2009/28/ES, protože statistické systémy v některých zemích ještě nejsou plně vyvinuty tak, aby splňovaly všechny požadavky této směrnice. Více informací o metodice výpočtu podílů energie z obnovitelných zdrojů lze nalézt na stránkách Eurostatu. |
| Päiväys | |
| Lähde |
Own work based on: European-union-renewables-fr.svg and EU-candidate countries map.svg
|
| Tekijä | Murraybuckley, Jklamo, Elekhh, Knumitiv |
| Käyttöoikeus (Tämän tiedoston uudelleenkäyttö) |
The author had released a previous version into the public domain |
| Muut versiot |
 |
| SVG kehittely | Tämä vektorigrafiikkatiedosto luotiin käyttäen apuna ohjelmaa Inkscape. |
Lisenssi
| Minä, tämän teoksen tekijänoikeudellinen omistaja, julkaisen tämän teoksen public domainiin eli luovun kaikista tekijänoikeuksista lain sallimissa puitteissa. Tämä on voimassa maailmanlaajuisesti. Joissain maissa laki ei mahdollista tätä. Mikäli näin on: Myönnän kenelle tahansa oikeuden käyttää tätä teosta mihin tahansa tarkoitukseen, ilman mitään ehtoja, ellei laki vaadi ehtojen asettamista. |
Tiedoston historia
Päiväystä napsauttamalla näet, millainen tiedosto oli kyseisellä hetkellä.
| Päiväys | Pienoiskuva | Koko | Käyttäjä | Kommentti | |
|---|---|---|---|---|---|
| nykyinen | 9. tammikuuta 2024 kello 21.39 | | 558 × 457 (313 KiB) | Jexio | Updated to 2022 figures |
| 17. elokuuta 2023 kello 21.03 |  | 558 × 457 (313 KiB) | Jexio | Updated to 2021 figures | |
| 22. tammikuuta 2022 kello 23.00 |  | 558 × 457 (313 KiB) | Jexio | Updated to 2020 figures | |
| 13. tammikuuta 2022 kello 00.39 |  | 558 × 457 (313 KiB) | Pavouk | change labels: open fonts | |
| 10. maaliskuuta 2021 kello 14.59 |  | 558 × 457 (318 KiB) | Knumitiv | 2019 data including Bosnia and Kosovo, without Turkey and Switzerland | |
| 13. helmikuuta 2019 kello 23.15 |  | 703 × 581 (118 KiB) | Heycci | Updated to 2017 figures. Added white background. | |
| 16. helmikuuta 2018 kello 01.34 |  | 703 × 581 (118 KiB) | Heycci | Updated to 2016 figures. | |
| 22. huhtikuuta 2015 kello 14.43 |  | 703 × 581 (126 KiB) | Rfassbind | update Eurostat 2013-figures (see description). Changed colors: UK (>5%) and Slovakia (<10%). Fixed colors for Swedish islands. Amended text in image. | |
| 15. joulukuuta 2014 kello 18.40 |  | 703 × 581 (126 KiB) | Rfassbind | Update Switzerland. Amended country's color code and map's footnote. Swiss figures: 21.5% for 2013, Swiss Federal Office of Energy (SFOE). | |
| 7. huhtikuuta 2014 kello 23.57 |  | 703 × 581 (109 KiB) | Heycci | Added Switzerland data from 2010 as well. Also (during last update) expanded the table to include 50 - 60% and > 60%. |
Tiedoston käyttö
Seuraava sivu käyttää tätä tiedostoa:
Tiedoston järjestelmänlaajuinen käyttö
Seuraavat muut wikit käyttävät tätä tiedostoa:
- Käyttö kohteessa ca.wikipedia.org
- Käyttö kohteessa cs.wikipedia.org
- Käyttö kohteessa da.wikipedia.org
- Käyttö kohteessa de.wikipedia.org
- Käyttö kohteessa de.wiktionary.org
- Käyttö kohteessa el.wikipedia.org
- Käyttö kohteessa en.wikipedia.org
- Käyttö kohteessa es.wikipedia.org
- Käyttö kohteessa fr.wikipedia.org
- Käyttö kohteessa hu.wikipedia.org
- Käyttö kohteessa hy.wikipedia.org
- Käyttö kohteessa id.wikipedia.org
- Käyttö kohteessa it.wikipedia.org
- Käyttö kohteessa nl.wikipedia.org
- Käyttö kohteessa pt.wikipedia.org
- Käyttö kohteessa sq.wikipedia.org
- Käyttö kohteessa zh.wikipedia.org