Tiedosto:DK opinion polls 2011 election.png
Siirry navigaatioon
Siirry hakuun
Tarkempaa kuvaa ei ole saatavilla.
DK_opinion_polls_2011_election.png (778 × 487 kuvapistettä, 9 KiB, MIME-tyyppi: image/png)
| Tämä tiedosto on tiedostotietokanta Wikimedia Commonsista. Tiedot kuvaussivulta näkyvät alla. |  |
Tiedoston kuvaussivu Commonsissa |
Yhteenveto
| Kuvaus |
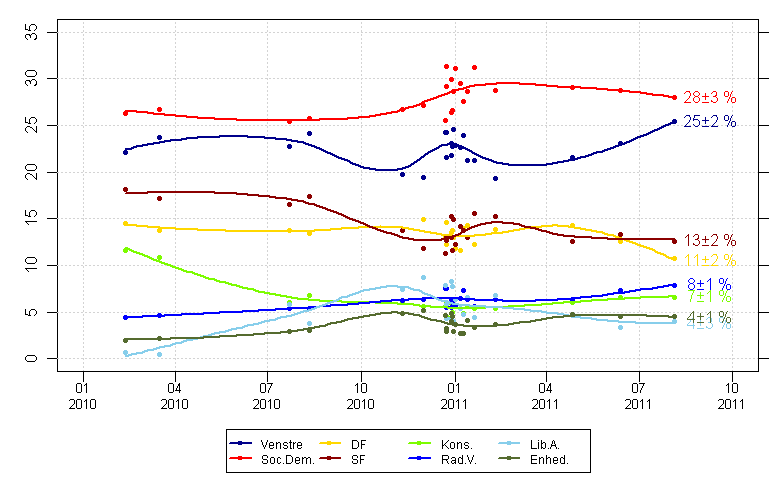
English: Graph showing support for political parties in Denmark since the start of 2010.Data is obtained from the Wikipedia page [1] |
| Päiväys | |
| Lähde | Oma teos |
| Tekijä | Mark Payne |
Figure is produced using the R statistical package, using the following code. It first reads the HTML directly from the website, then parses the data and saves the graph into your working directory. It should be able to be run directly by anyone with R.
rm(list=ls())

#Parameters
party.names <- c("Venstre","Soc.Dem.","DFP","SF","Kons.","Rad.V.","Lib.A.","Enhed.","KD")
parties.to.plot <- party.names[1:8]
party.cols    <- c("darkblue","red","gold","darkred","lawngreen","blue","darkolivegreen")
ylims <- c(0,35)
xlims <- c(ISOdate(2010,1,15),ISOdate(2011,10,15))
ticks <- ISOdate(rep(c(2010,2011),each=4),rep(c(1,4,7,10),times=2),15)

#Load the complete HTML file into memory
html <- readLines(url("http://en.wikipedia.org/wiki/Danish_parliamentary_election,_2011"),encoding="UTF-8")
closeAllConnections()

#Extract the opinion poll data table
tbl.no <- 6
tbl <- html[][tbl.no]):(grep("</table.*",html)[tbl.no])]

#Now split it into the rows, based on the <tr> tag
tbl.rows <- list()
open.tr <- grep("<tr",tbl)
close.tr <- grep("</tr",tbl)
for(i in 1:length(open.tr)) tbl.rows[[i]] <- tbl[][i]:close.tr[i]

#Throwout items that are headers or extra info
tbl.rows <- tbl.rows[sapply(tbl.rows,function(x) length(grep("<td",x)))>1]

#Now extract the data
survey.dat <- lapply(tbl.rows,function(x) {
  #Start by only considering where we have <td> tags
  td.tags <- x[grep("<td",x)]
  #Polling data appears in columns 3-10
  dat     <- td.tags[4:12]
  #Now strip the data and covert to numeric format
  dat     <- gsub("<td>|</td>","",dat)
  dat     <- gsub("<b>|</b>","",dat)
  dat     <- gsub("%","",dat)
  dat     <- gsub("-","0",dat)
  dat     <- as.numeric(dat)
  dat     <- ifelse(is.na(dat),0,dat)
  names(dat) <- party.names
  #Getting the date strings is a little harder. Start by tidying up the dates
  date.str <- td.tags[2]                        #Dates are in the second column
  date.str <- gsub("<td>|</td>","",date.str)  #Throw out any tags

  #And finally the survey time
  survey.time <- as.POSIXct(strptime(date.str,format="%Y-%m-%d"))
  #Get the name of the survey company too
  survey.comp <- td.tags[1]
  survey.comp <- gsub("<sup.*</sup>","",survey.comp)
  survey.comp <- gsub("<td>|</td>","",survey.comp)
  survey.comp <- gsub("<U+2013>","-",survey.comp,fixed=TRUE)
  survey.comp <- gsub("(?U)<.*>","",survey.comp,perl=TRUE)

  #And now return results
  return(data.frame(Company=survey.comp,Date=survey.time,date.str,t(dat)))
})

#Combine results
surveys <- do.call(rbind,survey.dat)

#Subset data to only plot selected parties in time window
polls   <- surveys[,c("Company","Date",parties.to.plot)]
polls <- subset(polls,!is.na(polls$Date) )
polls <- subset(polls,polls$Date>=min(xlims) )
polls <- polls[order(polls$Date),]
polls$date.num  <- as.double(polls$Date)

#Setup plot
png("DK_opinion_polls_2011_election.png",width=778,height=487,pointsize=16)
par(mar=c(3,4,1,1),oma=c(3,0,0,0))
matplot(polls$date.num,polls[,parties.to.plot],pch=NA,xlim=xlims,ylab="Party support (%)",xlab="",
  col=party.cols,xaxt="n",ylim=ylims)
abline(h=seq(0,95,by=5),col="lightgrey",lty=3)
abline(v=as.double(ticks),col="lightgrey",lty=3)
axis(1,at=as.double(ticks),labels=format(ticks,format="%b\n%Y"),cex.axis=0.8)
axis(4,at=axTicks(4),labels=rep("",length(axTicks(4))))

#Now calculate the loess smoothers and add the confidence interval
smoothed <- list()
predict.x <- seq(min(polls$date.num),max(polls$date.num),length.out=100)
for(i in 1:length(parties.to.plot)) {
  smoother <- loess(polls[][i] ~ polls[,"date.num"],span=0.75)
  smoothed[[i]] <- predict(smoother,newdata=predict.x,se=TRUE)
#  polygon(c(predict.x,rev(predict.x)),
#    c(smoothed[[i]]$fit+smoothed[[i]]$se.fit*1.96,rev(smoothed[[i]]$fit-smoothed[[i]]$se.fit*1.96)),
#    col=rgb(0.5,0.5,0.5,0.5),border=NA)
}
names(smoothed) <- parties.to.plot
#Then add the data points
matpoints(polls$date.num,polls[,parties.to.plot],pch=20,col=party.cols)
#And finally the smoothers themselves
for(i in 1:length(parties.to.plot)) {
  lines(predict.x,smoothed[[i]]$fit,col=party.cols[i],lwd=2)
}

legend(grconvertX(0.5,"npc"),grconvertY(0,"nfc"),legend=parties.to.plot,col=party.cols,
    pch=20,bg="white",lwd=2,ncol=ceiling(length(parties.to.plot)/2),cex=0.75,xpd=NA,xjust=0.5)

#Add best estimates
for(i in 1:length(smoothed)) {
  lbl <- sprintf("%2.0f ± %1.0f",round(rev(smoothed[[i]]$fit)[1],0),round(1.96*rev(smoothed[[i]]$se.fit)[1],0))
  text(rev(polls$date.num)[1],rev(smoothed[[i]]$fit)[1],labels=lbl,pos=4,col=party.cols[i])
}
dev.off()
Lisenssi
Minä, tämän teoksen tekijänoikeuksien haltija, julkaisen täten tämän teoksen seuraavalla lisenssillä:
Tämä tiedosto on lisensoitu Creative Commons Nimeä-JaaSamoin 3.0 Ei sovitettu -lisenssillä.
- Voit:
- jakaa – kopioida, levittää ja esittää teosta
- remiksata – valmistaa muutettuja teoksia
- Seuraavilla ehdoilla:
- nimeäminen – Sinun on mainittava lähde asianmukaisesti, tarjottava linkki lisenssiin sekä merkittävä, mikäli olet tehnyt muutoksia. Voit tehdä yllä olevan millä tahansa kohtuullisella tavalla, mutta et siten, että annat ymmärtää lisenssinantajan suosittelevan sinua tai teoksen käyttöäsi.
- jaa samoin – Jos muutat tai perustat tähän työhön, voit jakaa tuloksena syntyvää työtä vain tällä tai tämän kaltaisella lisenssillä.
Tiedoston historia
Päiväystä napsauttamalla näet, millainen tiedosto oli kyseisellä hetkellä.
| Päiväys | Pienoiskuva | Koko | Käyttäjä | Kommentti | |
|---|---|---|---|---|---|
| nykyinen | 22. elokuuta 2011 kello 22.59 | | 778 × 487 (9 KiB) | Trevva | Updated to include latest results |
| 2. maaliskuuta 2011 kello 12.16 |  | 778 × 487 (8 KiB) | Trevva | Fixed error with colours of the various parties | |
| 2. maaliskuuta 2011 kello 12.00 |  | 778 × 487 (8 KiB) | Trevva | Updated figure to include 24 February polls. Corrected abbreviation for Dansk Folksparti to DF | |
| 17. helmikuuta 2011 kello 16.49 |  | 778 × 487 (8 KiB) | Trevva | Added % symbols | |
| 17. helmikuuta 2011 kello 16.40 |  | 778 × 487 (8 KiB) | Trevva | Internationalised figure, so that it is does not contain any english or danish. | |
| 17. helmikuuta 2011 kello 15.53 |  | 778 × 487 (8 KiB) | Trevva | {{Information |Description ={{en|1=Graph showing support for political parties in Denmark since the start of 2010.Data is obtained from the Wikipedia page http://en.wikipedia.org/wiki/Danish_parliamentary_election,_2011}} |Source =Own work |
Tiedoston käyttö
Seuraava sivu käyttää tätä tiedostoa:
Tiedoston järjestelmänlaajuinen käyttö
Seuraavat muut wikit käyttävät tätä tiedostoa:
- Käyttö kohteessa en.wikibooks.org