Tiedosto:Milankovitch Variations.png
Milankovitch_Variations.png (479 × 363 kuvapistettä, 32 KiB, MIME-tyyppi: image/png)
| Tämä tiedosto on tiedostotietokanta Wikimedia Commonsista. Tiedot kuvaussivulta näkyvät alla. |  |
Tiedoston kuvaussivu Commonsissa |
Yhteenveto
| Kuvaus |
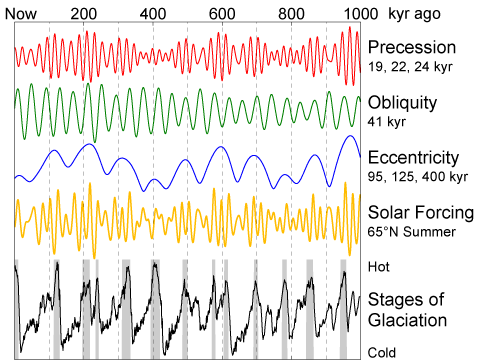
English: This figure shows the variations in Earth's orbit, the resulting changes in solar energy flux at high latitude, and the observed glacial cycles.
According to Milankovitch Theory, the precession of the equinoxes and the apsides, variations in the tilt of the Earth's axis (obliquity) and changes in the eccentricity of the Earth's orbit are responsible for causing the observed 100 kyr cycle in ice ages by varying the amount of sunlight received by the Earth at different times and locations, particularly high northern latitude summer. These changes in the Earth's orbit are the predictable consequence of interactions between the Earth, its moon, and the other planets. The orbital data shown are from Quinn et al. (1991). Principal frequencies for each of the three kinds of variations are labeled. The solar forcing curve (aka "insolation") is derived from July 1st sunlight at 65 °N latitude according to Jonathan Levine's insolation calculator [1]. The glacial data are from Lisiecki and Raymo (2005) and gray bars indicate interglacial periods, defined here as deviations in the 5 kyr average of at least 0.8 standard deviations above the mean. |
| Päiväys | 11. helmikuuta 2006 (tallennuspäivä) |
| Lähde | Oma teos |
| Tekijä | This image was produced by Robert A. Rohde from publicly available data, and is incorporated into the Global Warming Art project. |
| Muut versiot | Tämän tiedoston johdannaisteoksia: Variacions de Milankovitch.png |
References
- Lisiecki, L. E., and M. E. Raymo (2005), "A Pliocene-Pleistocene stack of 57 globally distributed benthic δ18O records." Paleoceanography 20, PA1003, doi:10.1029/2004PA001071 (alternative full text link: [2]).
- Quinn, T. R., S. Tremaine, and M. Duncan (1991), "A Three Million Year Integration of the Earth's Orbit." The Astronomical Journal 101, pp. 2287-2305, doi:10.1086/115850.

|
Tämä tyyppiä graph oleva kuva pitäisi luoda uudelleen SVG-tiedostoksi vektorigrafiikan avulla. Tällä tiedostotyypillä on monia vahvuuksia, sivulta Commons:Media for cleanup löytyy lisätietoja. Jos tästä kuvasta on jo olemassa SVG-versio, ole ystävällinen ja tallenna se tänne. SVG-tiedoston tallentamisen jälkeen vaihda tämä malline mallineeseen {{vector version available|uusi kuvan nimi.svg}}.
|
Lisenssi

|
Voit kopioida, levittää ja/tai muuttaa tätä asiakirjaa GNU Free Documentation License -lisenssin version 1.2 tai minkä tahansa Free Software Foundationin julkaiseman myöhemmän version ehtojen alaisena; ei koske muuttumattomia kohtia, etukannen tekstejä eikä takakannen tekstejä. Kopio tästä lisenssistä on saatavilla osiossa GNU Free Documentation License. |
| Tämä tiedosto on lisensoitu Creative Commons Nimeä-JaaSamoin 3.0 Ei sovitettu -lisenssillä. | ||
| ||
| Lisensointimerkintä lisätiin tähän tiedostoon osana GFDL-lisensointipäivitystä. |
Tiedoston historia
Päiväystä napsauttamalla näet, millainen tiedosto oli kyseisellä hetkellä.
| Päiväys | Pienoiskuva | Koko | Käyttäjä | Kommentti | |
|---|---|---|---|---|---|
| nykyinen | 11. helmikuuta 2006 kello 14.35 | | 479 × 363 (32 KiB) | David Legrand | == Description == This figure shows the variations in Earth's orbit, the resulting changes in solar energy flux at high latitude, and the observed glacial cycles. According to Milankovitch Theory, the precession of the [[ |
Tiedoston käyttö
Seuraava sivu käyttää tätä tiedostoa:
Tiedoston järjestelmänlaajuinen käyttö
Seuraavat muut wikit käyttävät tätä tiedostoa:
- Käyttö kohteessa af.wikipedia.org
- Käyttö kohteessa ar.wikipedia.org
- Käyttö kohteessa be.wikipedia.org
- Käyttö kohteessa bg.wikipedia.org
- Käyttö kohteessa ca.wikipedia.org
- Käyttö kohteessa da.wikipedia.org
- Käyttö kohteessa de.wikipedia.org
- Käyttö kohteessa de.wikiversity.org
- Käyttö kohteessa el.wikipedia.org
- Käyttö kohteessa en.wikipedia.org
- Käyttö kohteessa es.wikipedia.org
- Käyttö kohteessa fa.wikipedia.org
- Käyttö kohteessa fr.wikipedia.org
- Käyttö kohteessa fy.wikipedia.org
- Käyttö kohteessa gl.wikipedia.org
- Käyttö kohteessa hu.wikipedia.org
- Käyttö kohteessa hy.wikipedia.org
- Käyttö kohteessa id.wikipedia.org
- Käyttö kohteessa ja.wikipedia.org
- Käyttö kohteessa ko.wikipedia.org
- Käyttö kohteessa nl.wikipedia.org
Näytä lisää tämän tiedoston järjestelmänlaajuista käyttöä.