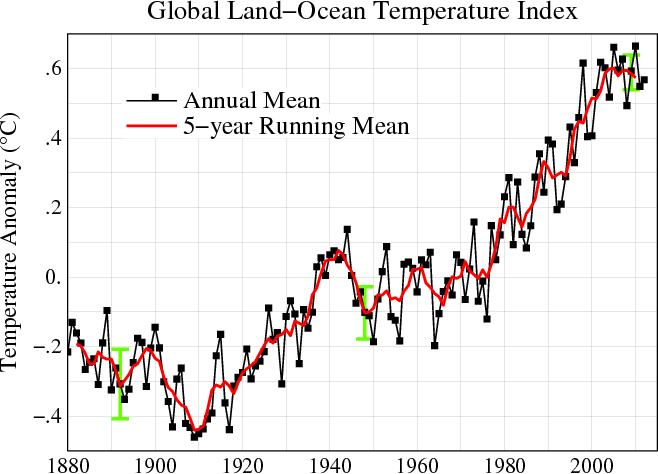
Tiedosto:Global Temperature Anomaly 1880-2010 (Fig.A).gif
Siirry navigaatioon
Siirry hakuun
Global_Temperature_Anomaly_1880-2010_(Fig.A).gif (658 × 474 kuvapistettä, 30 KiB, MIME-tyyppi: image/gif)
Tiedoston historia
Päiväystä napsauttamalla näet, millainen tiedosto oli kyseisellä hetkellä.
| Päiväys | Pienoiskuva | Koko | Käyttäjä | Kommentti | |
|---|---|---|---|---|---|
| nykyinen | 21. kesäkuuta 2013 kello 18.56 |  | 658 × 474 (30 KiB) | Nigelj | Upload version that has been updated with 2012 data |
| 20. tammikuuta 2012 kello 00.20 |  | 652 × 474 (31 KiB) | Simplex1swrhs | I have uploaded a new version of the NASA global temperature graph with 2011 data. | |
| 19. maaliskuuta 2011 kello 18.58 |  | 652 × 474 (31 KiB) | Simplex1swrhs | Switched back to the NASA GISS "Global Land-Ocean Temperature Index" graph with 2010 data update. {{Information |Description= Line plot of global mean land-ocean temperature index, 1880 to present, with the base period 1951-1980. The dotted black line is | |
| 3. maaliskuuta 2011 kello 23.05 |  | 655 × 439 (30 KiB) | OKIsItJustMe | {{Information |Description ={{en|1=Line plot of global mean land-ocean temperature index, 1880 to present, with the base period 1951-1980. The dotted black line is the annual mean and the solid red line is the five-year mean. The green bars show uncert |
Tiedoston käyttö
Tätä tiedostoa ei käytetä millään sivulla.
Tiedoston järjestelmänlaajuinen käyttö
Seuraavat muut wikit käyttävät tätä tiedostoa:
- Käyttö kohteessa ar.wikipedia.org
- Käyttö kohteessa en.wikipedia.org
- Käyttö kohteessa fr.wikipedia.org
- Käyttö kohteessa ko.wikipedia.org
- Käyttö kohteessa no.wikipedia.org
- Käyttö kohteessa vi.wikipedia.org
- Käyttö kohteessa zh.wikipedia.org


