| KuvausNgrip yd pb do18 ch4 2.png |
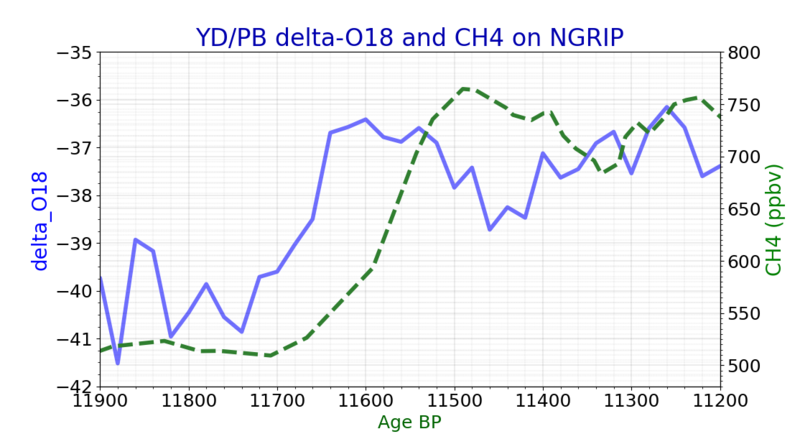
English: End of ice age methane and temperature related data curves from Greenland NGRIP ice core. There was rapid transition from cold to warmer conditions around North Atlantic ocean. Younger dryas/preboreal limit is seen on delta-O18 and (d-O18) methane (CH4) curve in data extracted from NGRIP ice core.
Curves .pnf iaege roduced with Gnuplot 4.6 win
Note: grip all text from data files, if ypou use Gnuplot!
Delta-Oxygen-18 data comes from
ftp://ftp.ncdc.noaa.gov/pub/data/paleo/icecore/greenland/summit/ngrip/gicc05-20yr.txt
- IGBP PAGES/WDCA CONTRIBUTION SERIES NUMBER: 2006-118
- NAME OF DATA SET: Greenland Ice Core Chronology 2005 (GICC05)
- LAST UPDATE: Released 27 November 2006, received by WDC #Paleo 12/2006.
Original file name: GICC05_NGRIP_GRIP_20y_27nov2006
- SUGGESTED DATA CITATION:
- NGRIP dating group, 2006.
- Greenland Ice Core Chronology 2005 (GICC05).
- IGBP PAGES/World Data Center for Paleoclimatology
- Data Contribution Series # 2006-118.
- NOAA/NCDC Paleoclimatology Program, Boulder CO, USA.
Methane data comes from
ftp://ftp.ncdc.noaa.gov/pub/data/paleo/icecore/greenland/summit/ngrip/gases/ngrip2012ch4.txt
- NGRIP Ice Core 32-11KYrBP Methane Data
"Date: 10-17-2012
- Authors: M. Baumgartner, A. Schilt, O. Eicher, J. Schmitt, J. Schwander, R. Spahni, H. Fischer, and T. F. Stocker
- Journal Name: Biogeosciences
- Published Title: High-resolution interpolar difference of atmospheric methane around the Last Glacial Maximum
- Published Date: 10-16-2012
- DOI: 10.5194/bg-9-3961-2012
Python 3 script
- drawing climate diagram in python 3
- version 2.11
- 11.9.2020
-
import matplotlib.pyplot as plt
import numpy as np
import pandas as pd
from matplotlib.ticker import (MultipleLocator, AutoMinorLocator)
from scipy import interpolate
import scipy.signal
from scipy.interpolate import CubicSpline
def running_mean(x, N):
cumsum = np.cumsum(np.insert(x, 0, 0))
return (cumsum[N:] - cumsum[:-N]) / float(N)
minx11=11200
maxx11=11900
miny11=-35
maxy11=-42
minx21=minx11
maxx21=maxx11
miny21=480
maxy21=800
savsize1=5 # savgol filtering buffer size
datafilename1="ngrip_1_ngrip_2_grip.csv"
datafilename2="ngrip_ch4_1.csv"
captioni="YD/PB delta-O18 and CH4 on NGRIP"
savename="ngrip_do18_ch4_yd_pb_1.svg"
column01="age_b2k"
column02="dO18_ngrip2"
column11="age_gas_calBP"
column12="ch4_ppb"
figsizex=16
figsizey=8
size0=14
size1=16
size2=18
size3=24
dfin00=pd.read_csv(datafilename1, sep=";")
dfin10=pd.read_csv(datafilename2, sep=";")
lst01=[column01, column02]
lst02=[column11, column12]
dfin01 = dfin00[dfin00.columns.intersection(lst01)]
dfin11 = dfin10[dfin10.columns.intersection(lst02)]
x10=dfin01[column01]
y10=dfin01[column02]
x20=dfin11[column11]
y20=dfin11[column12]
x1=x10[::2]
y1=y10[::2]
x2=x20
y2=y20
print (x1)
print(y1)
- y_savgol = scipy.signal.savgol_filter(y,31, 3)
y1_savgol = scipy.signal.savgol_filter(y1,savsize1, 3)
x1_sm = x1
y1_sm = y1
x1_smooth = np.linspace(x1_sm.min(), x1_sm.max(), 2000)
- x1_smooth= np.linspace(minx11,maxx11, 2000)
funk1 = interpolate.interp1d(x1_sm, y1_sm, kind="cubic")
y1_smooth = funk1(x1_smooth)
fig, ax1= plt.subplots()
ax2 = ax1.twinx()
ax1.set_xlim(minx11,maxx11)
ax1.set_ylim(miny11, maxy11)
ax2.set_xlim(minx21,maxx21)
ax2.set_ylim(miny21, maxy21)
plt.gca().invert_xaxis()
ax1.invert_yaxis()
ax1.set_ylabel('delta_O18', color='#0000ff', fontsize=size2+2)
ax2.set_ylabel('CH4 (ppbv)', color='#007f00', fontsize=size2+2)
ax1.plot(x1,y1, color="#7070ff", linewidth=4,label="NGRIP delta-O18")
- ax1.plot(x1_smooth,y1_smooth, color="#0000ff", linewidth=4,label="NGRIP delta-O18")
- ax1.plot(x1,y1_savgol, color="#0000ff", linewidth=3, label="SavGol filter,"+str(savsize1)+" and 3")
ax1.tick_params(axis='both', which='major', labelsize=size2)
ax1.xaxis.set_minor_locator(MultipleLocator(100))
ax1.xaxis.set_minor_locator(MultipleLocator(20))
ax1.yaxis.set_minor_locator(MultipleLocator(5.0))
ax1.yaxis.set_minor_locator(MultipleLocator(0.25))
ax1.grid(which='major', linestyle='-', linewidth='0.1', color='black')
ax1.grid(which='minor', linestyle=':', linewidth='0.1', color='black')
ax1.set_xlabel('Age BP', color="darkgreen", fontsize=size2)
ax1.set_title(captioni, fontsize=size3, color="#0000af")
ax2.plot(x2,y2, color="#307f30", linestyle="--", linewidth=4,label="NGRIP CH4 ppvb")
- ax2.plot(x2_smooth,y1_smooth, color="#0000ff", linewidth=4,label="NGRIP delta-O18")
- ax1.plot(x2,y2_savgol, color="#5fA05f", linewidth=3, label="SavGol filter,"+str(71)+" and 3")
ax2.tick_params(axis='both', which='major', labelsize=size2)
ax2.yaxis.set_minor_locator(MultipleLocator(50))
ax2.yaxis.set_minor_locator(MultipleLocator(5))
ax2.grid(which='major', linestyle='-', linewidth='0.1', color='black')
ax2.grid(which='minor', linestyle=':', linewidth='0.1', color='black')
- plt.legend()
- ax1.legend(fontsize=size0)
- ax2.legend(fontsize=size0)
fig = plt.gcf()
fig.set_size_inches(figsizex, figsizey, forward=True)
- plt.savefig(savename, format="svg", dpi = 100)
plt.show()
Old stuff
Gnuplot 4.6 script, very experimental one!
- !/gnuplot
- G N U P L O T
- Version 4.6 patchlevel 3 last modified April 2013
- Build System: MS-Windows 32 bit
- Copyright (C) 1986-1993, 1998, 2004, 2007-2013
- Thomas Williams, Colin Kelley and many others
- gnuplot home: http://www.gnuplot.info
- faq, bugs, etc: type "help FAQ"
- immediate help: type "help" (plot window: hit 'h')
- set terminal png nocrop font "Arial,15" fontscale 1.0 size 1280,960
- set output
unset clip points
set clip one
unset clip two
set bar 1.000000 front
set border 31 front linetype -1 linewidth 1.000
set timefmt z "%d/%m/%y,%H:%M"
set zdata
set timefmt y "%d/%m/%y,%H:%M"
set ydata
set timefmt x "%d/%m/%y,%H:%M"
set xdata
set timefmt cb "%d/%m/%y,%H:%M"
set timefmt y2 "%d/%m/%y,%H:%M"
set y2data
set timefmt x2 "%d/%m/%y,%H:%M"
set x2data
set boxwidth
set style fill empty border
set style rectangle back fc lt -3 fillstyle solid 1.00 border lt -1
set style circle radius graph 0.02, first 0, 0
set style ellipse size graph 0.05, 0.03, first 0 angle 0 units xy
set dummy x,y
set format x "% g"
set format y "% g"
set format x2 "% g"
set format y2 "% g"
set format z "% g"
set format cb "% g"
set format r "% g"
set angles radians
unset grid
set raxis
set key title ""
set key inside right top vertical Right noreverse enhanced autotitles nobox
set key noinvert samplen 4 spacing 1 width 0 height 0
set key maxcolumns 0 maxrows 0
set key noopaque
unset label
set label 1 "(null)" at 0, 0, 0 left norotate font "Arial, 18" back nopoint offset character 0, 0, 0
unset arrow
set style increment default
unset style line
unset style arrow
set style histogram clustered gap 2 title offset character 0, 0, 0
unset logscale
set offsets 0, 0, 0, 0
set pointsize 1
set pointintervalbox 1
set encoding default
unset polar
unset parametric
unset decimalsign
set view 60, 30, 1, 1
set samples 100, 100
set isosamples 10, 10
set surface
unset contour
set clabel '%8.3g'
set mapping cartesian
set datafile separator whitespace
unset hidden3d
set cntrparam order 4
set cntrparam linear
set cntrparam levels auto 5
set cntrparam points 5
set size ratio 0 1,1
set origin 0,0
set style data points
set style function lines
set xzeroaxis linetype -2 linewidth 1.000
set yzeroaxis linetype -2 linewidth 1.000
set zzeroaxis linetype -2 linewidth 1.000
set x2zeroaxis linetype -2 linewidth 1.000
set y2zeroaxis linetype -2 linewidth 1.000
set ticslevel 0.5
set mxtics default
set mytics default
set mztics default
set mx2tics default
set my2tics default
set mcbtics default
set xtics border in scale 1,0.5 mirror norotate offset character 0, 0, 0 autojustify
set xtics 100 norangelimit font "Arial, 18"
set ytics border in scale 1,0.5 mirror norotate offset character 0, 0, 0 autojustify
set ytics autofreq norangelimit font "Arial, 15"
set ztics border in scale 1,0.5 nomirror norotate offset character 0, 0, 0 autojustify
set ztics autofreq norangelimit
set nox2tics
set noy2tics
set cbtics border in scale 1,0.5 mirror norotate offset character 0, 0, 0 autojustify
set cbtics autofreq norangelimit
set rtics axis in scale 1,0.5 nomirror norotate offset character 0, 0, 0 autojustify
set rtics autofreq norangelimit
set title "NGRIP YD/PB data"
set title offset character 0, 0, 0 font "" norotate
set timestamp bottom
set timestamp ""
set timestamp offset character 0, 0, 0 font "" norotate
set rrange [ * : * ] noreverse nowriteback
set trange [ * : * ] noreverse nowriteback
set urange [ * : * ] noreverse nowriteback
set vrange [ * : * ] noreverse nowriteback
set xlabel "a BP"
set xlabel offset character 0, 0, 0 font "" textcolor lt -1 norotate
set x2label ""
set x2label offset character 0, 0, 0 font "" textcolor lt -1 norotate
set xrange [ 11000.0 : 12000.0 ] reverse nowriteback
set x2range [ * : * ] noreverse nowriteback
set ylabel "d-O18"
set ylabel offset character 0, 0, 0 font "" textcolor lt -1 rotate by -270
set y2label ""
set y2label offset character 0, 0, 0 font "" textcolor lt -1 rotate by -270
set yrange [ * : * ] noreverse nowriteback
set y2range [ * : * ] noreverse nowriteback
set zlabel ""
set zlabel offset character 0, 0, 0 font "" textcolor lt -1 norotate
set zrange [ * : * ] noreverse nowriteback
set cblabel ""
set cblabel offset character 0, 0, 0 font "" textcolor lt -1 rotate by -270
set cbrange [ * : * ] noreverse nowriteback
set zero 1e-008
set lmargin -1
set bmargin -1
set rmargin -1
set tmargin -1
set locale "Finnish_Finland.1252"
set pm3d explicit at s
set pm3d scansautomatic
set pm3d interpolate 1,1 flush begin noftriangles nohidden3d corners2color mean
set palette positive nops_allcF maxcolors 0 gamma 1.5 color model RGB
set palette rgbformulae 7, 5, 15
set colorbox default
set colorbox vertical origin screen 0.9, 0.2, 0 size screen 0.05, 0.6, 0 front bdefault
set style boxplot candles range 1.50 outliers pt 7 separation 1 labels auto unsorted
set loadpath
set fontpath
set psdir
set fit noerrorvariables
GNUTERM = "windows"
plot 'C:\gnuplot46\oma\ngripdo181_s13.txt' using 1:3 with lines lw 2 title "d-O18", 'C:\gnuplot46\oma\ngripch41_s23.txt' using 2:((($3-750)/50)-38) with lines lw 2 lc rgb "#005f00" title "CH4"
- EOF
|


