Tiedosto:Extinction Intensity.svg

Alkuperäinen tiedosto (SVG-tiedosto; oletustarkkuus 577 × 428 kuvapistettä; tiedostokoko 194 KiB)
| Tämä tiedosto on tiedostotietokanta Wikimedia Commonsista. Tiedot kuvaussivulta näkyvät alla. |  |
Tiedoston kuvaussivu Commonsissa |
| Kuvaus | A hand made lookalike for User:Dragons flight's PNG image Image:Extinction Intensity.png at en.wikipedia. | ||||||||
| Päiväys | (UTC) | ||||||||
| Lähde | Oma teos | ||||||||
| Tekijä | Rursus | ||||||||
| Käyttöoikeus (Tämän tiedoston uudelleenkäyttö) |
|
||||||||
| Muut versiot |
|


Yhteenveto

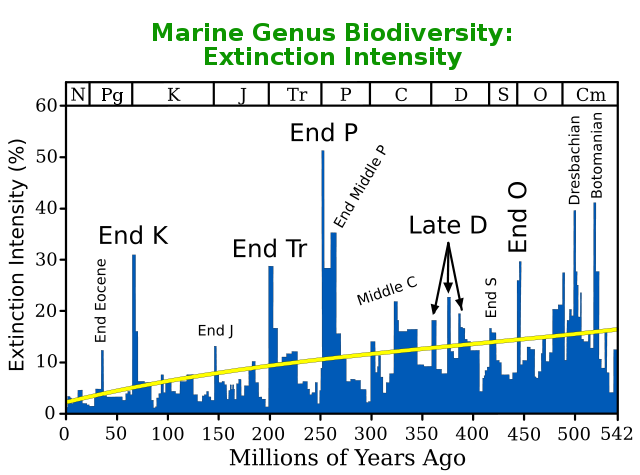
This figure shows the genus extinction intensity, i.e. the fraction of genera that are present in each interval of time but do not exist in the following interval. The data itself is taken from Rohde & Muller (2005, Supplementary Material), and are based on the Sepkoski's Compendium of Marine Fossil Animal Genera (2002). The yellow line is a cubic polynomial to show the long-term trend. Note that these data do not represent all genera that have ever lived, but rather only a selection of marine genera whose qualities are such that they are easily preserved as fossils.
NO MAS AL MALTRATO ANIMAL:
Lo que podemos entender no es posible que ya hace tiempo esto sucedió en mas de mil muertes de animales inocentes , debemos parar ante esto, debemos ayudar también al medio ambiente , gracias a ello , vemos que da vida a todos no solo a los bellos animales que hay en el mundo , nosotros mismos debemos cambiar esto cuidemos el medio ambiente y no al maltrato animal.
The "Big Five" mass extinctions (Raup & Sepkoski 1982) are labeled in large font, and a variety of other features are labeled in smaller font. The two extinction events occurring in the Cambrian (i.e. Dresbachian and Botomian) are very large in percentage magnitude, but are not well known because of the relative scarcity of fossil-producing life at that time (i.e. they are small in absolute numbers of known taxa). The Middle Permian extinction is now argued by many to constitute a distinct extinction horizon, though the actual extinction amounts are sometimes lumped together with the End Permian extinctions in reporting. As indicated, the "Late Devonian" extinction is actually resolvable into at least three distinct events spread over a period of ~40 million years. As these data are derived at the genus level, one can anticipate that the number of species extinctions is a higher percentage than shown here.
Many of the extinction events appear to be somewhat extended in time. In at least some cases this is the result of a paleontological artifact known as the Signor-Lipps effect (Signor & Lipps 1982). Briefly, this is the observation that inadequate sampling can cause a taxon to seem to disappear before its actual time of extinction. This has the effect of making an extinction event appear extended even if it occurred quite rapidly. Hence, when estimating the true magnitude of an extinction event it would be common to combine together the events occurring over several preceding bins as long as they also show excess extinctions. This explains why many estimates of the magnitude of an extinction event may be larger than the 20-30% shown as the largest single bin for most of the extinctions shown here.
References
- Raup, D. & Sepkoski, J. (1982). "Mass extinctions in the marine fossil record". Science 215: 1501–1503.
- Rohde, R.A. & Muller, R.A. (2005). "Cycles in fossil diversity". Nature 434: 209-210.
- Sepkoski, J. (2002) A Compendium of Fossil Marine Animal Genera (eds. Jablonski, D. & Foote, M.) Bull. Am. Paleontol. no. 363 (Paleontological Research Institution, Ithaca, NY).
- Signor, P. and J. Lipps (1982) "Sampling bias, gradual extinction patterns and catastrophes in the fossil record", in Geologic Implications of Impacts of Large Asteroids and Comets on the Earth, I. Silver and P. Silver Eds, Geol. Soc. Amer. Special Paper 190, Boulder Colo. p. 291-296.
Tiedoston historia
Päiväystä napsauttamalla näet, millainen tiedosto oli kyseisellä hetkellä.
| Päiväys | Pienoiskuva | Koko | Käyttäjä | Kommentti | |
|---|---|---|---|---|---|
| nykyinen | 6. joulukuuta 2007 kello 23.03 | | 577 × 428 (194 KiB) | Rursus | Font and outline fixes |
| 6. joulukuuta 2007 kello 22.55 |  | 577 × 428 (55 KiB) | Rursus | {{Information |Description=A hand made lookalike for the PNG image Image:Extinction Intensity.png at en.wikipedia. |Source=self-made |Date=~~~~~ |Author=Rursus |Permission={{GFDL}} inherited from Dragons flight |oth |
Tiedoston käyttö
Seuraava sivu käyttää tätä tiedostoa:
Tiedoston järjestelmänlaajuinen käyttö
Seuraavat muut wikit käyttävät tätä tiedostoa:
- Käyttö kohteessa ar.wikipedia.org
- Käyttö kohteessa be-tarask.wikipedia.org
- Käyttö kohteessa bg.wikipedia.org
- Käyttö kohteessa bs.wikipedia.org
- Käyttö kohteessa ca.wikipedia.org
- Käyttö kohteessa da.wikipedia.org
- Käyttö kohteessa en.wikipedia.org
- Käyttö kohteessa en.wikiversity.org
- Käyttö kohteessa eo.wikipedia.org
- Käyttö kohteessa es.wikipedia.org
- Käyttö kohteessa et.wikipedia.org
- Käyttö kohteessa fr.wikipedia.org
- Käyttö kohteessa he.wikipedia.org
- Käyttö kohteessa hr.wikipedia.org
- Käyttö kohteessa la.wikipedia.org
- Käyttö kohteessa mk.wikipedia.org
- Käyttö kohteessa ms.wikipedia.org
- Käyttö kohteessa nn.wikipedia.org
- Käyttö kohteessa no.wikipedia.org
- Käyttö kohteessa pt.wikipedia.org
- Käyttö kohteessa sh.wikipedia.org
- Käyttö kohteessa sr.wikipedia.org
- Käyttö kohteessa vi.wikipedia.org
- Käyttö kohteessa www.wikidata.org
- Käyttö kohteessa zh.wikipedia.org