Tiedosto:8200kyr event1.jpg

Alkuperäinen tiedosto (671 × 791 kuvapistettä, 117 KiB, MIME-tyyppi: image/jpeg)
| Tämä tiedosto on tiedostotietokanta Wikimedia Commonsista. Tiedot kuvaussivulta näkyvät alla. |  |
Tiedoston kuvaussivu Commonsissa |
Yhteenveto
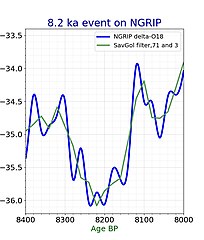
| Kuvaus | 8200 kyr cold event seen in NGRIP corve, time goes from right to left, numbers thousand of uears ago down is colder, up is warmer. |
| Päiväys | |
| Lähde | Oma teos |
| Tekijä | Merikanto |
=Additional information
Source of data is NGRIP1, NGRIP2 and GRIP data
http://www.iceandclimate.nbi.ku.dk/data/Rasmussen_et_al_2014_QSR_Table_2.xlsx
GISP2, GRIP and NGRIP
GICC05modelext timescale for the gas and ice phase of the GISP2 and GRIP ice cores (0-104 ka b2k) and various data series
A mirrored version of the xlsx file and a raw text version are available from WDC Paleo.
This data file accompanies the following two papers:
Seierstad et al. (2014):
Consistently dated records from the Greenland GRIP, GISP2 and NGRIP ice cores for the past 104 ka reveal regional millennial-scale δ18O gradients with possible Heinrich event imprint.
doi:10.1016/j.quascirev.2014.10.032
Rasmussen et al. (2014):
A stratigraphic framework for abrupt climatic changes during the Last Glacial period based on three synchronized Greenland ice-core records: refining and extending the INTIMATE event stratigraphy.
doi:10.1016/j.quascirev.2014.09.007
Download an Excel version of Table 2 of this paper
The data file (xlsx format) contains
-    Match points between the GRIP, GISP2, NGRIP1 and NGRIP2 cores.
-    NGRIP, GRIP and GISP2 δ18O and calcium concentration resampled to 20 yrs and 50 yrs resolution on the GICC05modelext timescale.
-    GRIP δ18O resampled to 0.55 m ("bag") resolution on the GICC05modelext timescale.
-    A GICC05modelext depth-age scale to be used with publicly available GISP2 ion concentration data.
-    GRIP and GISP2 GICC05modelext gas timescale.
-    Compilations of GRIP and GISP2 CH4 concentration and δ15N of N2 on the GICC05modelext gas timescale.
d18O data:
Grootes, P.M., Stuiver, M., 1997. Oxygen 18/16 variability in Greenland snow and ice with 10-3- to 105-year
time resolution. Journal of Geophysical Research 102, 26455-26470.
Johnsen, S.J., Clausen, H.B., Dansgaard, W., Gundestrup, N.S., Hammer, C.U., Andersen, U., Andersen, K.K.,
Hvidberg, C.S., Dahl-Jensen, D., Steffensen, J.P., Shoji, H., Sveinbjörnsdóttir, Á.E., White, J., Jouzel, J., Fisher,
D., 1997. The δ18O record along the Greenland Ice Core Project deep ice core and the problem of possible
Eemian climatic instability. Journal of Geophysical Research 102, 26397-26410.
North Greenland Ice Core Project members, 2004. High-resolution record of Northern Hemisphere climate
extending into the last interglacial period. Nature 431, 147-151.
Stuiver, M., Grootes, P.M., 2000. GISP2 oxygen isotope ratios. Quaternary Research 53, 277-284.
Python3 code
- drawing climate diagram in python 3
- version 2.11
- 11.9.2020
-
import matplotlib.pyplot as plt
import numpy as np
import pandas as pd
from matplotlib.ticker import (MultipleLocator, AutoMinorLocator)
from scipy import interpolate
import scipy.signal
from scipy.interpolate import CubicSpline
def running_mean(x, N):
   cumsum = np.cumsum(np.insert(x, 0, 0))
   return (cumsum[N:] - cumsum[:-N]) / float(N)
minx1=8000
maxx1=8400
miny1=-33.4
maxy1=-36.2
savsize1=5 #  savgol filtering buffer size
datafilename1="ngrip_1_ngrip_2_grip_holocene1.csv"
captioni="8.2 ka event on NGRIP"
savename="neem_ch4_yd_pb_1.svg"
- age_b2k;dO18_ngrip1;dO18_ngrip2;dO18_grip
column01="age_b2k"
column02="dO18_ngrip1"
figsizex=16
figsizey=8


size0=14
size1=16
size2=18
size3=24


dfin00=pd.read_csv(datafilename1, sep=";")


lst01=[column01, column02]
dfin01 = dfin00[dfin00.columns.intersection(lst01)]
x0=dfin00[column01]
y0=dfin01[column02]


x=x0[::2]
y=y0[::2]
dfin01[column02].rolling(11).mean()
- x=x0
- y=y0
- points = zip(x0, y0)
- points = sorted(points, key=lambda point: point[0])
- x, y = zip(*points)
- x=np.array(x).astype(float)
- y=np.array(y).astype(float)
- y_savgol = scipy.signal.savgol_filter(y,31, 3)
y_savgol = scipy.signal.savgol_filter(y,savsize1, 3)
- print(x)
x_sm = x
y_sm = y
- print (x_sm)
x_smooth = np.linspace(x_sm.min(), x_sm.max(), 2000)
x_smooth= np.linspace(minx1,maxx1, 2000)
funk1 = interpolate.interp1d(x_sm, y_sm, kind="cubic")
y_smooth = funk1(x_smooth)
xs = np.arange(minx1,maxx1,1)
- lenu=len(x)
- xn=np.arange(1,lenu,1)
- cs = CubicSpline(xn, y)
fig, ax1 = plt.subplots()
- ax1.axis((11600,14000,0,ymax1))
ax1.set_xlim(minx1,maxx1)
ax1.set_ylim(miny1, maxy1)
- ax1.set_ylim(-35.0, -42.0)
plt.gca().invert_xaxis()
plt.gca().invert_yaxis()
ax1.set_ylabel('CH4 (ppbv)', color='#0000ff', fontsize=size2+2)
- ax1.plot(x,y, color="#7070ff", linewidth=4,label="NGRIP delta-O18")
ax1.plot(x_smooth,y_smooth, color="#0000ff", linewidth=4,label="NGRIP delta-O18")
ax1.plot(x,y_savgol, color="#5fA05f", linewidth=3, label="SavGol filter,"+str(71)+" and 3")
- ax1.plot(x,cs(xs), color="#007f00", linewidth=4,label="Smoothed")
ax1.tick_params(axis='both', which='major', labelsize=size2)
ax1.xaxis.set_minor_locator(MultipleLocator(100))
ax1.xaxis.set_minor_locator(MultipleLocator(20))
ax1.yaxis.set_minor_locator(MultipleLocator(1.0))
ax1.yaxis.set_minor_locator(MultipleLocator(0.1))
ax1.grid(which='major', linestyle='-', linewidth='0.1', color='black')
ax1.grid(which='minor', linestyle=':', linewidth='0.1', color='black')


ax1.set_xlabel('Age BP', color="darkgreen", fontsize=size2)


ax1.set_title(captioni, fontsize=size3, color="#0000af")
plt.legend(fontsize=size0)
fig = plt.gcf()
fig.set_size_inches(figsizex, figsizey, forward=True)
- plt.savefig(savename, format="svg", dpi = 100)
plt.show()
Lisenssi
| Minä, tämän teoksen tekijänoikeudellinen omistaja, julkaisen tämän teoksen public domainiin eli luovun kaikista tekijänoikeuksista lain sallimissa puitteissa. Tämä on voimassa maailmanlaajuisesti. Joissain maissa laki ei mahdollista tätä. Mikäli näin on: Myönnän kenelle tahansa oikeuden käyttää tätä teosta mihin tahansa tarkoitukseen, ilman mitään ehtoja, ellei laki vaadi ehtojen asettamista. |
Tiedoston historia
Päiväystä napsauttamalla näet, millainen tiedosto oli kyseisellä hetkellä.
| Päiväys | Pienoiskuva | Koko | Käyttäjä | Kommentti | |
|---|---|---|---|---|---|
| nykyinen | 13. syyskuuta 2020 kello 13.50 | | 671 × 791 (117 KiB) | Merikanto | New layout |
| 10. elokuuta 2008 kello 13.42 |  | 754 × 606 (54 KiB) | Merikanto~commonswiki | {{Information |Description=8200 event in NGROP delta-O18 curve. X-axis, time before past in years. Y-axis, delta-O!8 in NGRIP sample. Delte-O!( depends on temperature, up is warmer, down is colder in this image, so higher delta-018 means colder in Greenla | |
| 3. joulukuuta 2007 kello 23.38 |  | 924 × 669 (174 KiB) | Merikanto~commonswiki | {{Information |Description=8200 kyr cold event seen in NGRIP corve, time goes from right to left, numbers thousand of uears ago down is colder, up is warmer. |Source=self-made |Date=3.12.2007 |Author= Merikanto |Permission={{PD-Own}} |o |
Tiedoston käyttö
Seuraava sivu käyttää tätä tiedostoa: